Blog on Stocks for March 12, 2024.

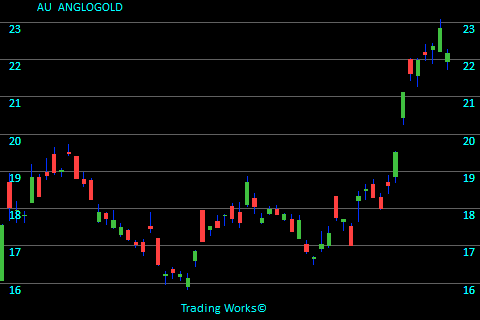
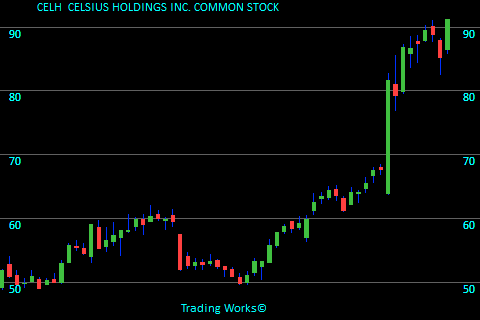
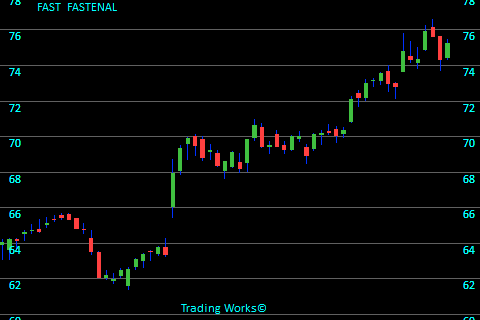
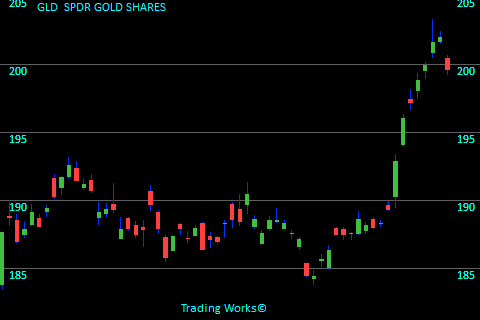
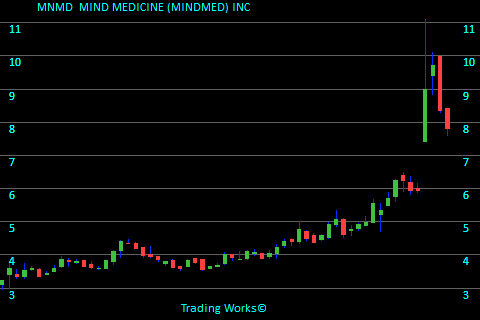
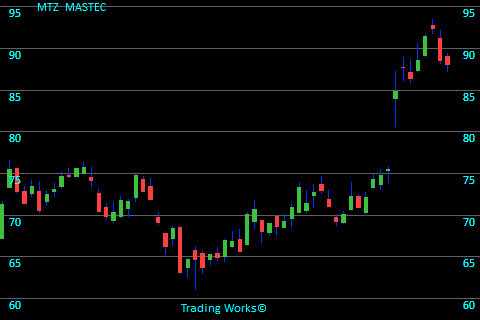
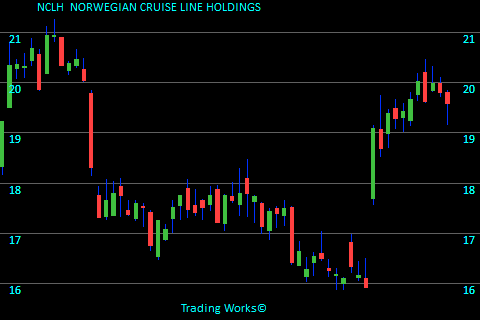
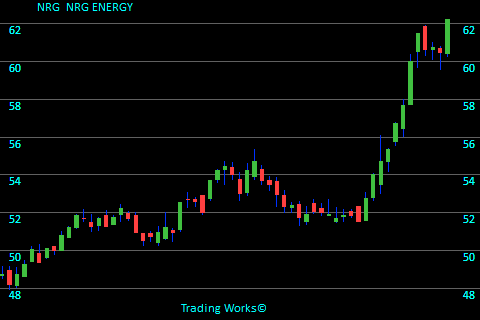
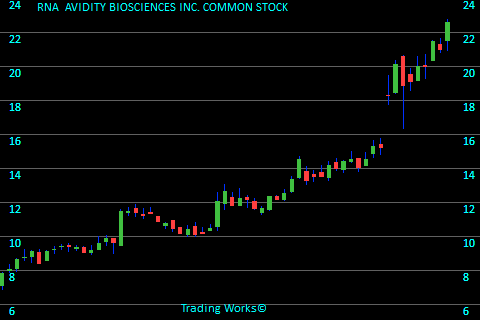
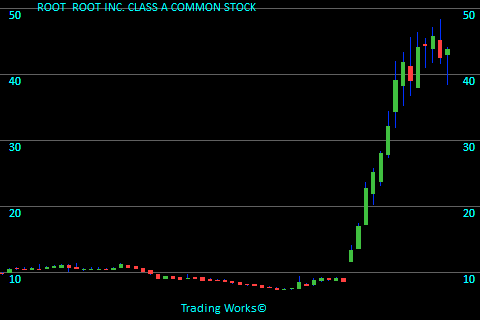
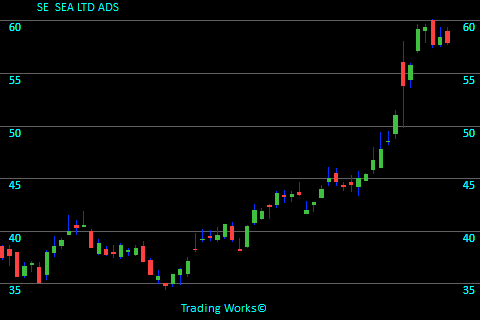
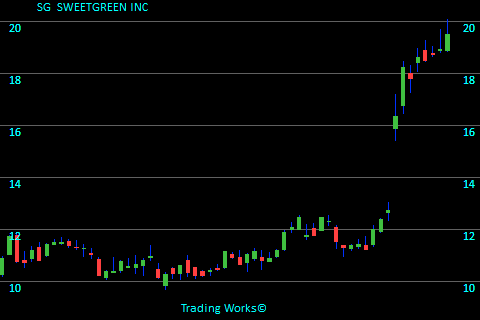
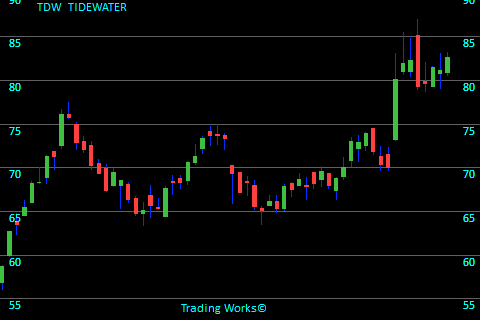
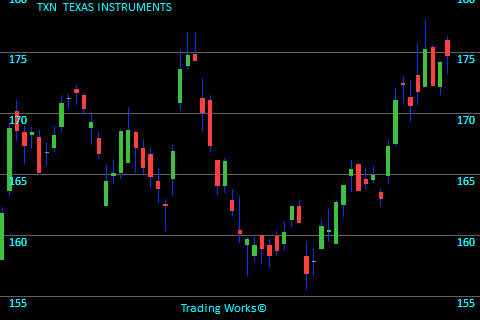
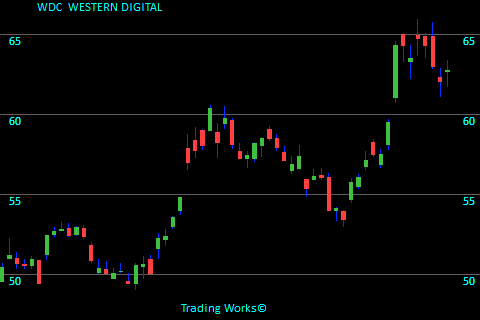
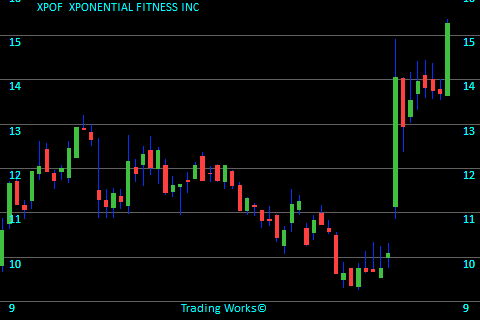
These stocks appeared on one of our screening reports approximately 10 trading days ago and are further limited to ones that have some Stock-Options (Calls and Puts) with decent trading volume.

We provide these for education purposes only and not making a recommendation... especially on a delayed report. We are just helping you see what you can do in a few short minutes per day.


Blog Index


AU

ANGLOGOLD


AU is grouped in the Gold sector. Recently AU deserved some scrutiny because it was showing upward strength in the price. The stock closed back then at $19.50. Referring to the chart here, the last price is $22.16 meaning the stock moved up $2.66 per share. That looks like a 13.6% increase. To see more information click here: Todays chart for AU.
The chart on the right shows what we saw 8 trading days ago. The green arrows on the chart mark the point that we took interest.


CELH

CELSIUS HOLDINGS INC. COMMON STOCK


CELH is in the Beverages - Non-Alcoholic sector. At the end of the trading day 14 days ago CELH showed up on our stock radar because the price increase was exceeding the expected pace. The stock closed back then at $64.13. At the time of this blog, the attached chart show a last price of $91.18 meaning the stock had risen by $27.05 per share. It computes to a 42.2% increase. To see more information click here: Todays chart for CELH.
The chart on the right shows what we saw 14 trading days ago. The green arrows on the chart mark the point that we took interest.


FAST

FASTENAL


FAST fits in the Industrial Distribution sector. A few days back FAST grabbed 10 seconds of our time due to the fact it had a good improvement in its price. The stock ended trading at $72.06. Looking at this chart we see the final price is $75.23 meaning the stock gained $3.17 per share. That looks like a 4.4% increase. To see more information click here: Todays chart for FAST.
The chart on the right shows what we saw 14 trading days ago. The green arrows on the chart mark the point that we took interest.


GLD

SPDR GOLD SHARES


Not long ago GLD became attention worthy because it has moved up sharply in recent days. The stock closed for that day at $192.89. Referring to the chart here, the last price is $199.65 meaning the stock moved up $6.76 per share. That equates to a 3.5% increase. To see more information click here: Todays chart for GLD.
The chart on the right shows what we saw 8 trading days ago. The green arrows on the chart mark the point that we took interest.


IRM

IRON MOUNTAIN INC REIT


IRM is grouped in the REIT - Specialty sector. A few days back IRM gave us a reason to review the charts because it was showing upward strength in the price. The stock closed back then at $72.10. At the time of this blog, the attached chart show a last price of $80.77 meaning the stock went up $8.67 per share. That looks like a 12.0% increase. To see more information click here: Todays chart for IRM.
The chart on the right shows what we saw 14 trading days ago. The green arrows on the chart mark the point that we took interest.


KR

KROGER


KR is part of the Grocery Stores sector. Only a few days ago KR became attention worthy because it has gained strength. The stock closed back then at $48.37. Referring to the chart here, the last price is $55.45 meaning the stock climbed by $7.08 per share. That calculates in at a 14.6% increase. To see more information click here: Todays chart for KR.
The chart on the right shows what we saw 11 trading days ago. The green arrows on the chart mark the point that we took interest.


LNW

LIGHT & WONDER INC. COMMON STOCK


LNW belongs to the Gambling sector. It was 14 days ago that LNW gave us a reason to review the charts since its price was progressing well. The stock closed back then at $91.00. Looking at this chart we see the final price is $101.57 meaning the stock rose $10.57 per share. This works out to a 11.6% increase. To see more information click here: Todays chart for LNW.
The chart on the right shows what we saw 14 trading days ago. The green arrows on the chart mark the point that we took interest.


LOW

LOWE'S COMPANIES


LOW is related to the Home Improvement Retail sector. Not so long ago LOW caught our attention since it jumped in value recently. The stock closed back then at $230.51. The last closing price on this chart is $243.07 meaning the stock had risen by $12.56 per share. That equates to a 5.4% increase. To see more information click here: Todays chart for LOW.
The chart on the right shows what we saw 14 trading days ago. The green arrows on the chart mark the point that we took interest.


MNMD

MIND MEDICINE (MINDMED) INC


MNMD is categorized under the Biotechnology sector. Only 11 days ago MNMD gave us a reason to review the charts because the stock is holding above the previous trading range. The stock closed on that day at $5.56. Looking at this chart we see the final price is $7.82 meaning the stock went up $2.26 per share. It computes to a 40.6% increase. To see more information click here: Todays chart for MNMD.
The chart on the right shows what we saw 11 trading days ago. The green arrows on the chart mark the point that we took interest.


MTZ

MASTEC


MTZ is grouped in the Engineering & Construction sector. Recently (8 days ago) MTZ caught our attention because it showed itself rising nicely. The stock ended trading at $84.85. The last closing price on this chart is $88.06 meaning the stock had risen by $3.21 per share. This banks in at a 3.8% increase. To see more information click here: Todays chart for MTZ.
The chart on the right shows what we saw 8 trading days ago. The green arrows on the chart mark the point that we took interest.


NCLH

NORWEGIAN CRUISE LINE HOLDINGS


NCLH stands in the Travel Services sector. Only a few days ago NCLH popped up on our screen since it jumped in value recently. The stock closed back then at $19.09. Referring to the chart here, the last price is $19.59 meaning the stock had risen by $0.50 per share. This banks in at a 2.6% increase. To see more information click here: Todays chart for NCLH.
The chart on the right shows what we saw 11 trading days ago. The green arrows on the chart mark the point that we took interest.


NRG

NRG ENERGY


NRG is grouped in the Utilities - Independent Power Producers sector. It was 8 days ago that NRG was listed in our Strong Trend report because the price increase was exceeding the expected pace. The stock closed on that day at $56.71. The last closing price on this chart is $62.21 meaning the stock increased by $5.50 per share. This works out to a 9.7% increase. To see more information click here: Todays chart for NRG.
The chart on the right shows what we saw 8 trading days ago. The green arrows on the chart mark the point that we took interest.


NTAP

NETAPP


NTAP is linked with the Computer Hardware sector. Not so long ago NTAP was listed in our Strong Trend report There is no guarantee that it will rise, but it's certainly worth watching. To see more information click here: Todays chart for NTAP.
The chart on the right shows what we saw 8 trading days ago. The green arrows on the chart mark the point that we took interest.


NVDA

NVIDIA


NVDA is categorized in the Semiconductors sector. Only a few days ago NVDA showed up on our stock radar because it showed itself rising nicely. The stock closed on that day at $785.38. Referring to the chart here, the last price is $910.67 meaning the stock increased by $125.29 per share. This banks in at a 16.0% increase. To see more information click here: Todays chart for NVDA.
The chart on the right shows what we saw 14 trading days ago. The green arrows on the chart mark the point that we took interest.


NVDL

GRANITESHARES 1.5X LONG NVDA DAILY ETF


Recently (14 days ago) NVDL grabbed 10 seconds of our time since it jumped in value recently. The stock finished trading at $194.59. Referring to the chart here, the last price is $256.56 meaning the stock had risen by $61.97 per share. That equates to a 31.8% increase. To see more information click here: Todays chart for NVDL.
The chart on the right shows what we saw 14 trading days ago. The green arrows on the chart mark the point that we took interest.


QCOM

QUALCOMM


QCOM is linked with the Semiconductors sector. Not long ago QCOM gave us a reason to review the charts because the price increase was exceeding the expected pace. The stock closed on that day at $163.09. Referring to the chart here, the last price is $173.01 meaning the stock rose $9.92 per share. It computes to a 6.1% increase. To see more information click here: Todays chart for QCOM.
The chart on the right shows what we saw 8 trading days ago. The green arrows on the chart mark the point that we took interest.


RNA

AVIDITY BIOSCIENCES INC. COMMON STOCK


RNA fits in the Biotechnology sector. A few days back RNA caught our attention on this day because the closing price finished higher than previous averages. The stock closed for that day at $15.31. The last closing price on this chart is $22.63 meaning the stock increased by $7.32 per share. This banks in at a 47.8% increase. To see more information click here: Todays chart for RNA.
The chart on the right shows what we saw 11 trading days ago. The green arrows on the chart mark the point that we took interest.


ROOT

ROOT INC. CLASS A COMMON STOCK


ROOT is linked with the Insurance - Property & Casualty sector. At the end of the trading day 14 days ago ROOT deserved some scrutiny because the price increase was exceeding the expected pace. The stock finished trading at $13.29. Referring to the chart here, the last price is $43.83 meaning the stock went up $30.54 per share. This works out to a 229.8% increase. To see more information click here: Todays chart for ROOT.
The chart on the right shows what we saw 14 trading days ago. The green arrows on the chart mark the point that we took interest.


SE

SEA LTD ADS


SE is associated with the Internet Retail sector. At the end of the trading day 11 days ago SE grabbed 10 seconds of our time since it jumped in value recently. The stock closed back then at $46.73. Referring to the chart here, the last price is $57.99 meaning the stock rose $11.26 per share. That equates to a 24.1% increase. To see more information click here: Todays chart for SE.
The chart on the right shows what we saw 11 trading days ago. The green arrows on the chart mark the point that we took interest.


SG

SWEETGREEN INC


SG is in the Restaurants sector. Not long ago SG caught our attention because the stock is holding above the previous trading range. The stock closed back then at $16.36. The last closing price on this chart is $19.53 meaning the stock climbed by $3.17 per share. It computes to a 19.4% increase. To see more information click here: Todays chart for SG.
The chart on the right shows what we saw 8 trading days ago. The green arrows on the chart mark the point that we took interest.


TDW

TIDEWATER


TDW is part of the Oil & Gas Equipment & Services sector. It was 8 days ago that TDW gave us a reason to review the charts because the stock is holding above the previous trading range. The stock ended trading at $80.09. The last closing price on this chart is $82.65 meaning the stock had risen by $2.56 per share. This works out to a 3.2% increase. To see more information click here: Todays chart for TDW.
The chart on the right shows what we saw 8 trading days ago. The green arrows on the chart mark the point that we took interest.


TXN

TEXAS INSTRUMENTS


TXN is grouped in the Semiconductors sector. It was 8 days ago that TXN showed up on our stock radar because the price increase was exceeding the expected pace. The stock ended trading at $171.05. Referring to the chart here, the last price is $174.76 meaning the stock increased by $3.71 per share. This works out to a 2.2% increase. To see more information click here: Todays chart for TXN.
The chart on the right shows what we saw 8 trading days ago. The green arrows on the chart mark the point that we took interest.


WDC

WESTERN DIGITAL


WDC is in the Computer Hardware sector. Not so long ago WDC gave us a reason to review the charts There is no guarantee that it will rise, but it's certainly worth watching. To see more information click here: Todays chart for WDC.
The chart on the right shows what we saw 8 trading days ago. The green arrows on the chart mark the point that we took interest.


XPOF

XPONENTIAL FITNESS INC


XPOF is linked with the Leisure sector. Not so long ago XPOF gave us a reason to review the charts because it showed itself rising nicely. The stock closed on that day at $14.05. Looking at this chart we see the final price is $15.27 meaning the stock had risen by $1.22 per share. That looks like a 8.7% increase. To see more information click here: Todays chart for XPOF.
The chart on the right shows what we saw 8 trading days ago. The green arrows on the chart mark the point that we took interest.


Trading stats for this day:
Total Value of stocks tracked is $90.6 Trillion.
Total Value recently traded was $508 Billion.
Total Value of Options traded (in our zone) was $1.3 Billion.

2,420,339 Call volume.
662,293 Put volume.

Blog Index
© publishing since 2005.