 |
Blog on Stocks for March 8, 2024.
These stocks appeared on one of our screening reports approximately 10 trading days ago and are further
limited to ones that have some Stock-Options (Calls and Puts) with decent trading volume.
We provide these for education purposes only and not making a recommendation... especially on a delayed report.
We are just helping you see what you can do in a few short minutes per day.

Blog Index
|
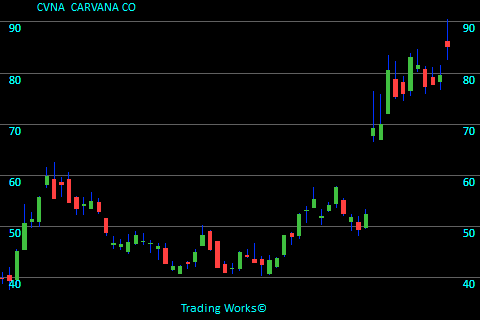
CVNACARVANA CO
CVNA is linked with the Auto & Truck Dealerships sector. Only a few days ago CVNA caught our attention because it showed itself rising nicely. The stock finished trading at $69.23. Referring to the chart here, the last price is $85.25 meaning the stock had risen by $16.02 per share. It computes to a 23.1% increase. To see more information click here: Todays chart for CVNA.
The chart on the right shows what we saw 11 trading days ago. The green arrows on the chart mark the point that we took interest. |
 |
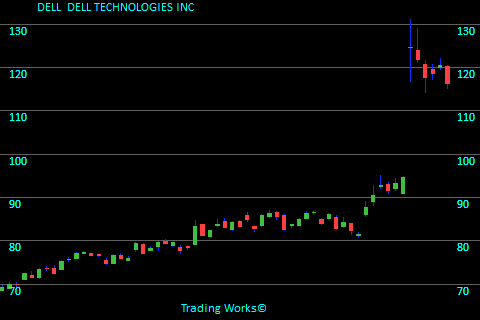
DELLDELL TECHNOLOGIES INC
DELL is linked with the Computer Hardware sector. A few days back DELL caused us to review the chart since its price was progressing well. The stock closed on that day at $90.35. Referring to the chart here, the last price is $116.25 meaning the stock moved up $25.90 per share. This banks in at a 28.7% increase. To see more information click here: Todays chart for DELL.
The chart on the right shows what we saw 11 trading days ago. The green arrows on the chart mark the point that we took interest. |
 |
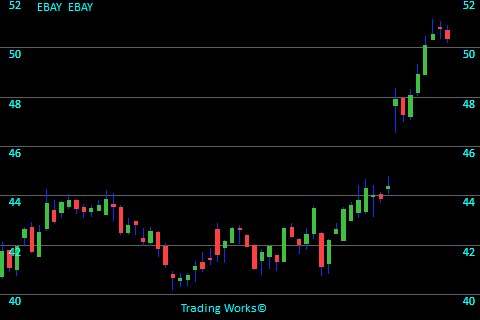
EBAYEBAY
EBAY is associated with the Internet Retail sector. At the end of the trading day 8 days ago EBAY caught our attention due to the fact it had a good improvement in its price. The stock closed back then at $47.89. Referring to the chart here, the last price is $50.37 meaning the stock had risen by $2.48 per share. That looks like a 5.2% increase. To see more information click here: Todays chart for EBAY.
The chart on the right shows what we saw 8 trading days ago. The green arrows on the chart mark the point that we took interest. |
 |
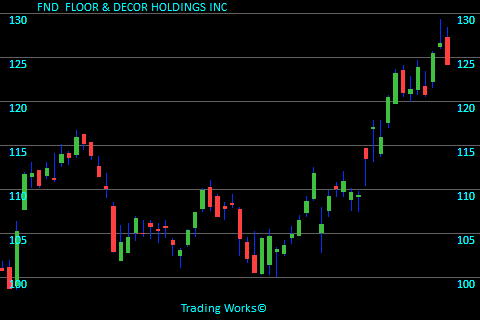
FNDFLOOR & DECOR HOLDINGS INC
FND is categorized in the Home Improvement Retail sector. Only 11 days ago FND grabbed 10 seconds of our time on this day because the closing price finished higher than previous averages. The stock ended trading at $117.11. The last closing price on this chart is $124.25 meaning the stock gained $7.14 per share. That equates to a 6.1% increase. To see more information click here: Todays chart for FND.
The chart on the right shows what we saw 11 trading days ago. The green arrows on the chart mark the point that we took interest. |
 |
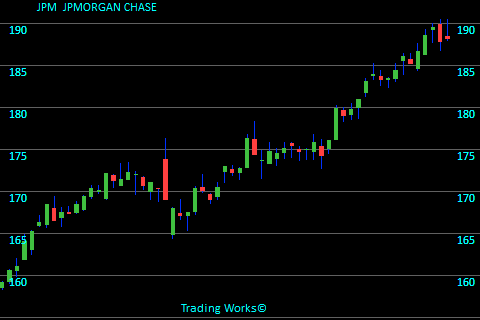
JPMJPMORGAN CHASE
JPM is in the Banks - Diversified sector. Just 14 days ago JPM caught our attention on this day because the closing price finished higher than previous averages. The stock finished trading at $179.73. At the time of this blog, the attached chart show a last price of $188.22 meaning the stock rose $8.49 per share. That looks like a 4.7% increase. To see more information click here: Todays chart for JPM.
The chart on the right shows what we saw 14 trading days ago. The green arrows on the chart mark the point that we took interest. |
 |
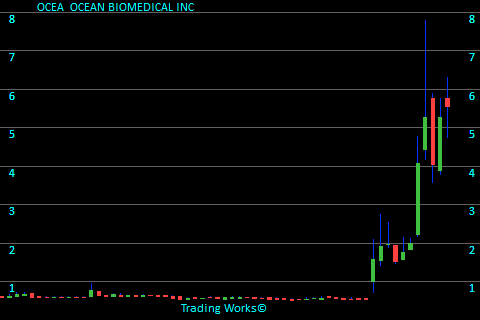
OCEAOCEAN BIOMEDICAL INC
OCEA is categorized in the Biotechnology sector. A few days back OCEA showed up on our stock radar because it has gained strength. The stock ended trading at $1.57. The last closing price on this chart is $5.56 meaning the stock climbed by $3.99 per share. That equates to a 254.1% increase. To see more information click here: Todays chart for OCEA.
The chart on the right shows what we saw 11 trading days ago. The green arrows on the chart mark the point that we took interest. |
 |
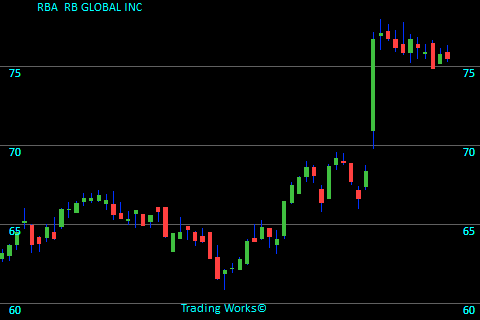
RBARB GLOBAL INC
RBA is categorized under the Specialty Business Services sector. Only 11 days ago RBA gave us a reason to review the charts There is no guarantee that it will rise, but it's certainly worth watching. To see more information click here: Todays chart for RBA.
The chart on the right shows what we saw 11 trading days ago. The green arrows on the chart mark the point that we took interest. |
 |
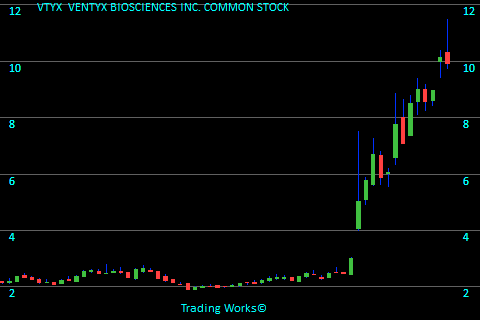
VTYXVENTYX BIOSCIENCES INC. COMMON STOCK
VTYX is grouped in the Biotechnology sector. Not so long ago VTYX gave us a reason to review the charts since its price was progressing well. The stock ended trading at $2.99. The last closing price on this chart is $9.92 meaning the stock had risen by $6.93 per share. That looks like a 231.8% increase. To see more information click here: Todays chart for VTYX.
The chart on the right shows what we saw 14 trading days ago. The green arrows on the chart mark the point that we took interest. |
 |
Trading stats for this day:
Total Value of stocks tracked is $90.0 Trillion.
Total Value recently traded was $701 Billion.
Total Value of Options traded (in our zone) was $2.2 Billion.
5,808,953 Call volume.
3,293,636 Put volume.
Blog Index
 © publishing since 2005.