 |
Blog on Stocks for March 7, 2024.
These stocks appeared on one of our screening reports approximately 10 trading days ago and are further
limited to ones that have some Stock-Options (Calls and Puts) with decent trading volume.
We provide these for education purposes only and not making a recommendation... especially on a delayed report.
We are just helping you see what you can do in a few short minutes per day.

Blog Index
|
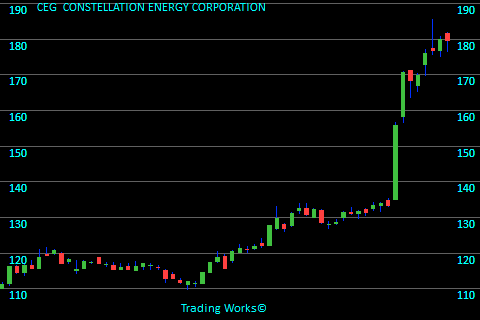
CEGCONSTELLATION ENERGY CORPORATION
CEG is grouped in the Utilities - Renewable sector. Not so long ago CEG showed up on our stock radar because it has gained strength. The stock closed back then at $155.76. The last closing price on this chart is $179.68 meaning the stock moved up $23.92 per share. This banks in at a 15.4% increase. To see more information click here: Todays chart for CEG.
The chart on the right shows what we saw 8 trading days ago. The green arrows on the chart mark the point that we took interest. |
 |
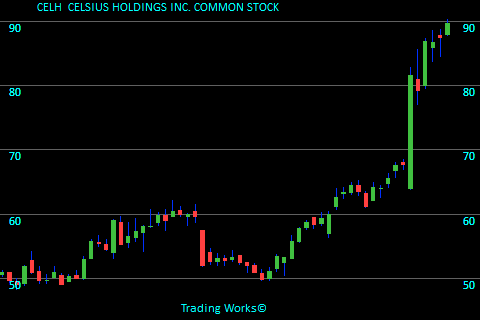
CELHCELSIUS HOLDINGS INC. COMMON STOCK
CELH is linked with the Beverages - Non-Alcoholic sector. A few days back CELH was listed in our Strong Trend report on this day because the closing price finished higher than previous averages. The stock closed back then at $64.13. For this chart, the closing price is $89.58 meaning the stock climbed by $25.45 per share. That equates to a 39.7% increase. To see more information click here: Todays chart for CELH.
The chart on the right shows what we saw 11 trading days ago. The green arrows on the chart mark the point that we took interest. |
 |
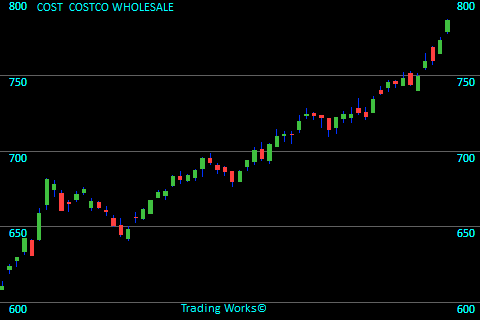
COSTCOSTCO WHOLESALE
COST is grouped in the Discount Stores sector. Just 11 days ago COST grabbed 10 seconds of our time on this day because the closing price finished higher than previous averages. The stock finished trading at $734.40. At the time of this blog, the attached chart show a last price of $786.15 meaning the stock climbed by $51.75 per share. That looks like a 7.0% increase. To see more information click here: Todays chart for COST.
The chart on the right shows what we saw 11 trading days ago. The green arrows on the chart mark the point that we took interest. |
 |
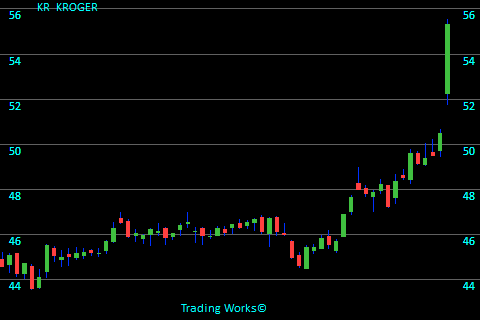
KRKROGER
KR is associated with the Grocery Stores sector. Recently (8 days ago) KR caught our attention because the price increase was exceeding the expected pace. The stock finished trading at $48.37. For this chart, the closing price is $55.32 meaning the stock went up $6.95 per share. This works out to a 14.4% increase. To see more information click here: Todays chart for KR.
The chart on the right shows what we saw 8 trading days ago. The green arrows on the chart mark the point that we took interest. |
 |
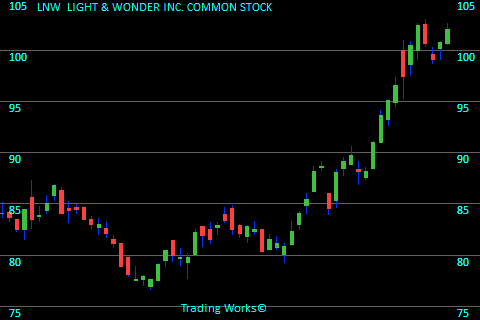
LNWLIGHT & WONDER INC. COMMON STOCK
LNW is grouped in the Gambling sector. Recently LNW showed up on our stock radar because this stock gained strength. The stock closed back then at $91.00. For this chart, the closing price is $102.03 meaning the stock climbed by $11.03 per share. That equates to a 12.1% increase. To see more information click here: Todays chart for LNW.
The chart on the right shows what we saw 11 trading days ago. The green arrows on the chart mark the point that we took interest. |
 |
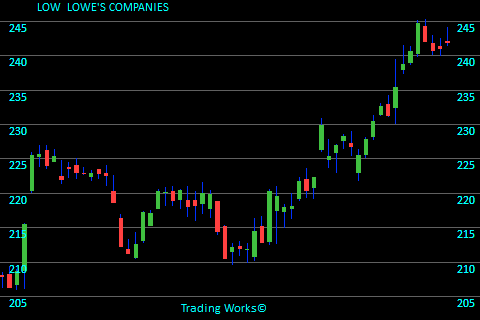
LOWLOWE'S COMPANIES
LOW is associated with the Home Improvement Retail sector. Only a few days ago LOW gave us a reason to review the charts because it has gained strength. The stock closed for that day at $230.51. At the time of this blog, the attached chart show a last price of $241.92 meaning the stock moved up $11.41 per share. This banks in at a 4.9% increase. To see more information click here: Todays chart for LOW.
The chart on the right shows what we saw 11 trading days ago. The green arrows on the chart mark the point that we took interest. |
 |
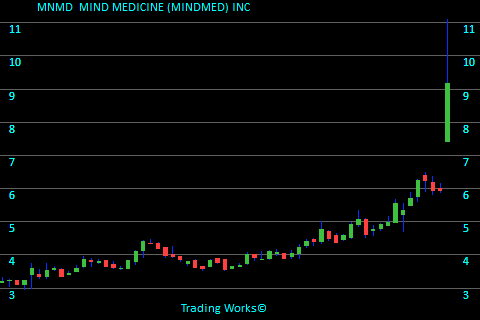
MNMDMIND MEDICINE (MINDMED) INC
MNMD is in the Biotechnology sector. It was 8 days ago that MNMD showed up on our stock radar because it has gained strength. The stock ended trading at $5.56. For this chart, the closing price is $9.16 meaning the stock moved up $3.60 per share. This works out to a 64.7% increase. To see more information click here: Todays chart for MNMD.
The chart on the right shows what we saw 8 trading days ago. The green arrows on the chart mark the point that we took interest. |
 |
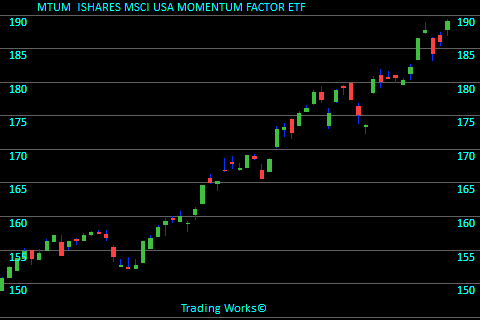
MTUMISHARES MSCI USA MOMENTUM FACTOR ETF
It was 11 days ago that MTUM caught our attention because it showed itself rising nicely. The stock closed on that day at $180.39. Looking at this chart we see the final price is $189.07 meaning the stock gained $8.68 per share. That looks like a 4.8% increase. To see more information click here: Todays chart for MTUM.
The chart on the right shows what we saw 11 trading days ago. The green arrows on the chart mark the point that we took interest. |
 |
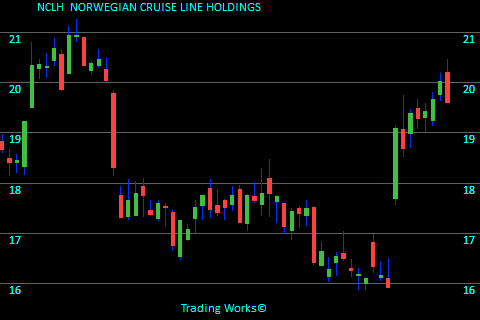
NCLHNORWEGIAN CRUISE LINE HOLDINGS
NCLH belongs to the Travel Services sector. Only 8 days ago NCLH gave us a reason to review the charts on this day because the closing price finished higher than previous averages. The stock closed on that day at $19.09. At the time of this blog, the attached chart show a last price of $19.60 meaning the stock climbed by $0.51 per share. It computes to a 2.7% increase. To see more information click here: Todays chart for NCLH.
The chart on the right shows what we saw 8 trading days ago. The green arrows on the chart mark the point that we took interest. |
 |
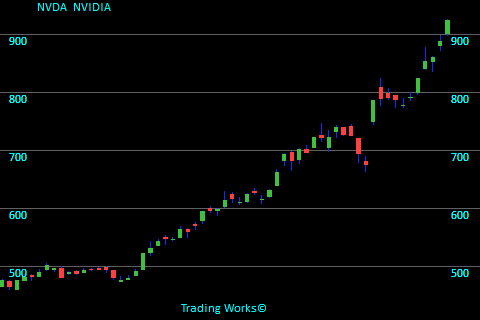
NVDANVIDIA
NVDA stands in the Semiconductors sector. At the end of the trading day 11 days ago NVDA was listed in our Strong Trend report because it has moved up sharply in recent days. The stock closed back then at $785.38. Looking at this chart we see the final price is $923.43 meaning the stock increased by $138.05 per share. That equates to a 17.6% increase. To see more information click here: Todays chart for NVDA.
The chart on the right shows what we saw 11 trading days ago. The green arrows on the chart mark the point that we took interest. |
 |
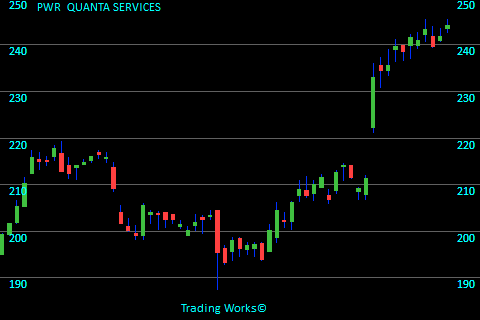
PWRQUANTA SERVICES
PWR is in the Engineering & Construction sector. Recently (11 days ago) PWR became attention worthy because it showed itself rising nicely. The stock closed on that day at $232.93. At the time of this blog, the attached chart show a last price of $244.04 meaning the stock rose $11.11 per share. This works out to a 4.8% increase. To see more information click here: Todays chart for PWR.
The chart on the right shows what we saw 11 trading days ago. The green arrows on the chart mark the point that we took interest. |
 |
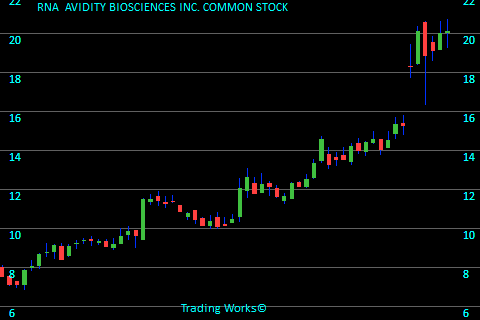
RNAAVIDITY BIOSCIENCES INC. COMMON STOCK
RNA fits in the Biotechnology sector. Recently RNA became attention worthy due to the fact it had a good improvement in its price. The stock finished trading at $15.31. Looking at this chart we see the final price is $20.11 meaning the stock increased by $4.80 per share. This banks in at a 31.4% increase. To see more information click here: Todays chart for RNA.
The chart on the right shows what we saw 8 trading days ago. The green arrows on the chart mark the point that we took interest. |
 |
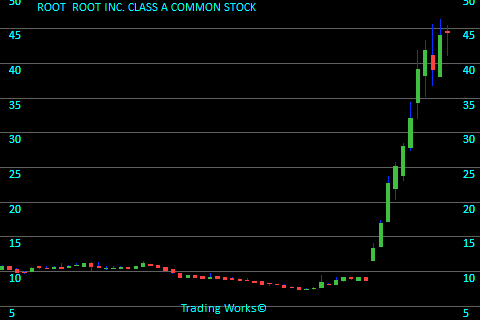
ROOTROOT INC. CLASS A COMMON STOCK
ROOT is part of the Insurance - Property & Casualty sector. Not so long ago ROOT caught our attention because this stock gained strength. The stock ended trading at $13.29. Referring to the chart here, the last price is $44.46 meaning the stock rose $31.17 per share. That calculates in at a 234.5% increase. To see more information click here: Todays chart for ROOT.
The chart on the right shows what we saw 11 trading days ago. The green arrows on the chart mark the point that we took interest. |
 |
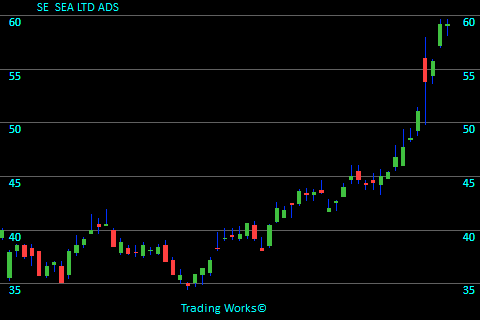
SESEA LTD ADS
SE belongs to the Internet Retail sector. Recently (8 days ago) SE was listed in our Strong Trend report because it has moved up sharply in recent days. The stock closed on that day at $46.73. The last closing price on this chart is $59.17 meaning the stock increased by $12.44 per share. That looks like a 26.6% increase. To see more information click here: Todays chart for SE.
The chart on the right shows what we saw 8 trading days ago. The green arrows on the chart mark the point that we took interest. |
 |
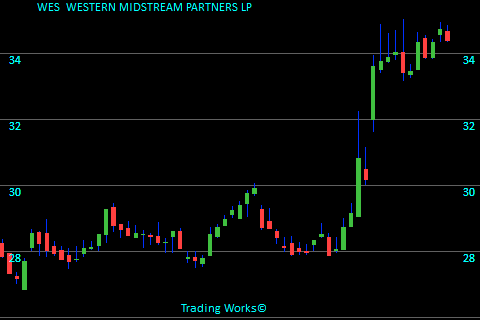
WESWESTERN MIDSTREAM PARTNERS LP
WES is linked with the Oil & Gas Midstream sector. Recently WES was listed in our Strong Trend report because it has moved up sharply in recent days. The stock finished trading at $33.60. Looking at this chart we see the final price is $34.39 meaning the stock increased by $0.79 per share. That equates to a 2.4% increase. To see more information click here: Todays chart for WES.
The chart on the right shows what we saw 11 trading days ago. The green arrows on the chart mark the point that we took interest. |
 |
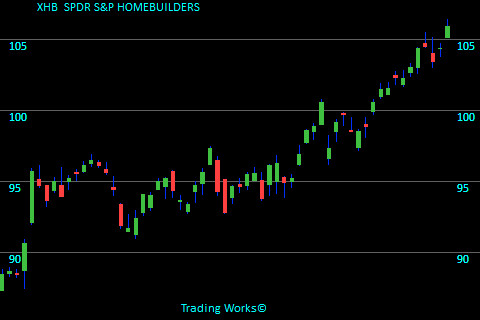
XHBSPDR S&P HOMEBUILDERS
It was 11 days ago that XHB caught our attention because the stock is holding above the previous trading range. The stock closed back then at $100.57. The last closing price on this chart is $105.96 meaning the stock moved up $5.39 per share. That looks like a 5.4% increase. To see more information click here: Todays chart for XHB.
The chart on the right shows what we saw 11 trading days ago. The green arrows on the chart mark the point that we took interest. |
 |
Trading stats for this day:
Total Value of stocks tracked is $90.2 Trillion.
Total Value recently traded was $504 Billion.
Total Value of Options traded (in our zone) was $2.5 Billion.
8,972,449 Call volume.
2,826,041 Put volume.
Blog Index
 © publishing since 2005.