 |
Blog on Stocks for March 6, 2024.
These stocks appeared on one of our screening reports approximately 10 trading days ago and are further
limited to ones that have some Stock-Options (Calls and Puts) with decent trading volume.
We provide these for education purposes only and not making a recommendation... especially on a delayed report.
We are just helping you see what you can do in a few short minutes per day.

Blog Index
|
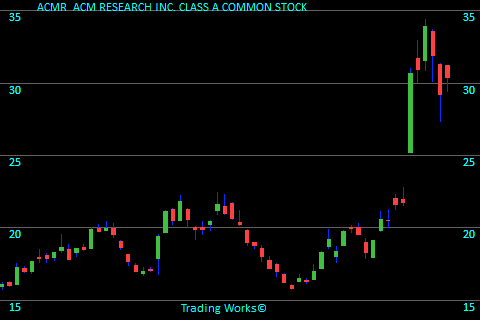
ACMRACM RESEARCH INC. CLASS A COMMON STOCK
ACMR stands in the Semiconductor Equipment & Materials sector. At the end of the trading day 8 days ago ACMR became attention worthy because it looks like an emerging opportunity. The stock closed on that day at $21.60. Looking at this chart we see the final price is $30.41 meaning the stock climbed by $8.81 per share. This banks in at a 40.8% increase. To see more information click here: Todays chart for ACMR.
The chart on the right shows what we saw 8 trading days ago. The green arrows on the chart mark the point that we took interest. |
 |
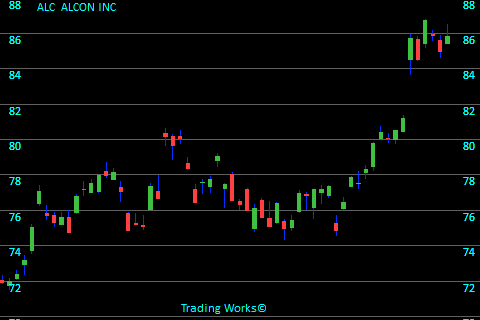
ALCALCON INC
ALC fits in the Medical Instruments & Supplies sector. Recently (11 days ago) ALC became attention worthy since its price was progressing well. The stock ended trading at $79.78. At the time of this blog, the attached chart show a last price of $85.83 meaning the stock advanced by $6.05 per share. That looks like a 7.6% increase. To see more information click here: Todays chart for ALC.
The chart on the right shows what we saw 11 trading days ago. The green arrows on the chart mark the point that we took interest. |
 |
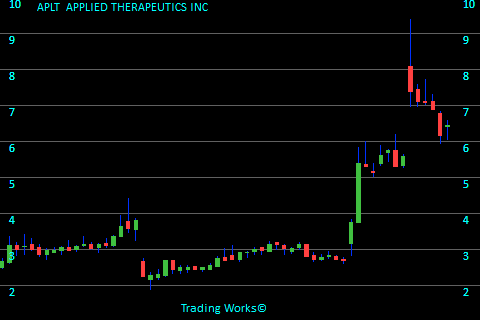
APLTAPPLIED THERAPEUTICS INC
APLT is categorized in the Biotechnology sector. Not long ago APLT popped up on our screen because the stock is holding above the previous trading range. The stock closed back then at $3.75. Looking at this chart we see the final price is $6.44 meaning the stock went up $2.69 per share. That calculates in at a 71.7% increase. To see more information click here: Todays chart for APLT.
The chart on the right shows what we saw 14 trading days ago. The green arrows on the chart mark the point that we took interest. |
 |
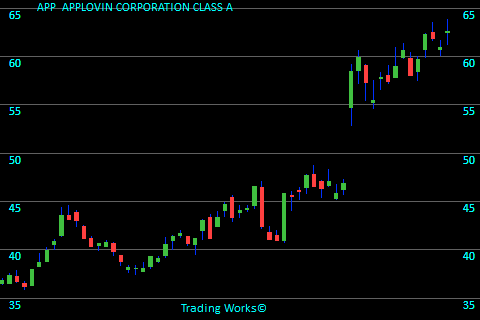
APPAPPLOVIN CORPORATION CLASS A
APP is grouped in the Software - Application sector. A few days back APP deserved some scrutiny because the price increase was exceeding the expected pace. The stock finished trading at $58.50. The last closing price on this chart is $62.59 meaning the stock climbed by $4.09 per share. That looks like a 7.0% increase. To see more information click here: Todays chart for APP.
The chart on the right shows what we saw 14 trading days ago. The green arrows on the chart mark the point that we took interest. |
 |
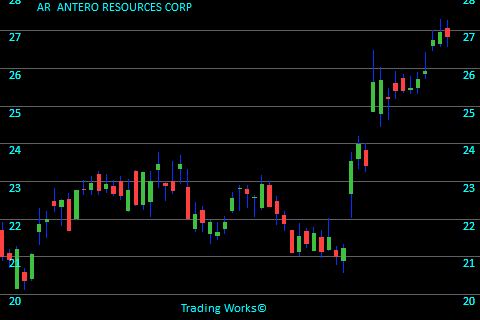
ARANTERO RESOURCES CORP
AR is grouped in the Oil & Gas E&P sector. Not so long ago AR showed up on our stock radar due to the fact it had a good improvement in its price. The stock ended trading at $25.63. The last closing price on this chart is $26.85 meaning the stock moved up $1.22 per share. This works out to a 4.8% increase. To see more information click here: Todays chart for AR.
The chart on the right shows what we saw 11 trading days ago. The green arrows on the chart mark the point that we took interest. |
 |
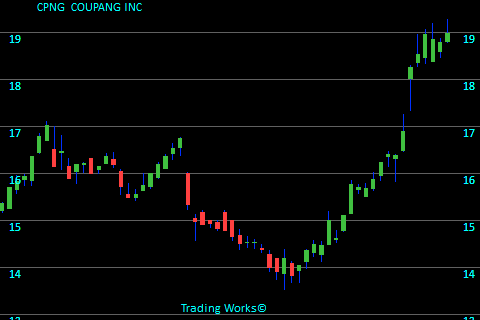
CPNGCOUPANG INC
CPNG fits in the Internet Retail sector. At the end of the trading day 14 days ago CPNG gave us a reason to review the charts because it looks like an emerging opportunity. The stock ended trading at $15.76. Referring to the chart here, the last price is $18.98 meaning the stock climbed by $3.22 per share. This works out to a 20.4% increase. To see more information click here: Todays chart for CPNG.
The chart on the right shows what we saw 14 trading days ago. The green arrows on the chart mark the point that we took interest. |
 |
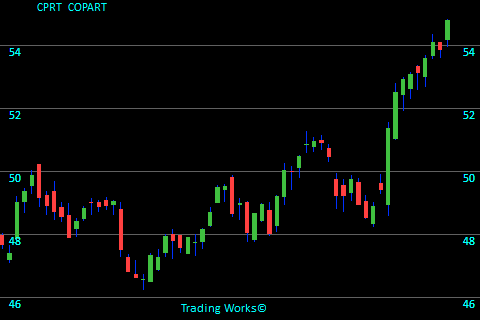
CPRTCOPART
CPRT is linked with the Specialty Business Services sector. It was 8 days ago that CPRT grabbed 10 seconds of our time due to the fact it had a good improvement in its price. The stock ended trading at $52.50. Looking at this chart we see the final price is $54.80 meaning the stock had risen by $2.30 per share. It computes to a 4.4% increase. To see more information click here: Todays chart for CPRT.
The chart on the right shows what we saw 8 trading days ago. The green arrows on the chart mark the point that we took interest. |
 |
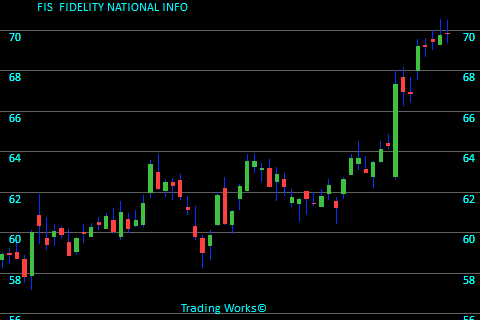
FISFIDELITY NATIONAL INFO
FIS is categorized in the Information Technology Services sector. Not so long ago FIS grabbed 10 seconds of our time because it was showing upward strength in the price. The stock closed back then at $67.33. The last closing price on this chart is $69.81 meaning the stock went up $2.48 per share. It computes to a 3.7% increase. To see more information click here: Todays chart for FIS.
The chart on the right shows what we saw 8 trading days ago. The green arrows on the chart mark the point that we took interest. |
 |
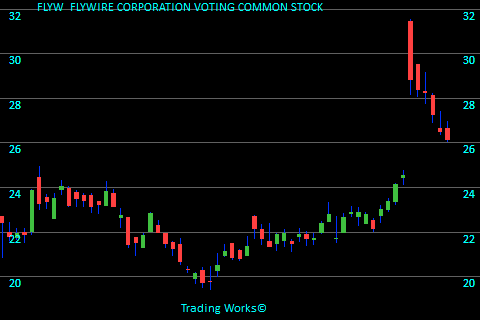
FLYWFLYWIRE CORPORATION VOTING COMMON STOCK
FLYW is associated with the Software - Infrastructure sector. Only a few days ago FLYW became attention worthy because it looks like an emerging opportunity. The stock closed on that day at $24.12. Looking at this chart we see the final price is $26.16 meaning the stock advanced by $2.04 per share. This works out to a 8.5% increase. To see more information click here: Todays chart for FLYW.
The chart on the right shows what we saw 8 trading days ago. The green arrows on the chart mark the point that we took interest. |
 |
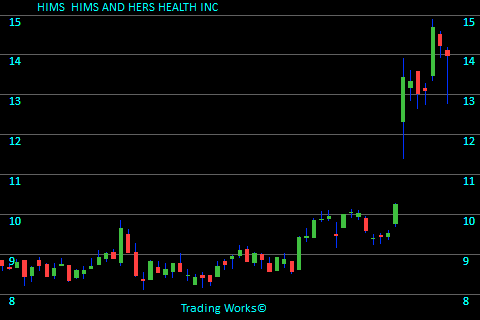
HIMSHIMS AND HERS HEALTH INC
HIMS stands in the Household & Personal Products sector. Only a few days ago HIMS was listed in our Strong Trend report due to the fact it had a good improvement in its price. The stock ended trading at $10.25. The last closing price on this chart is $13.98 meaning the stock had risen by $3.73 per share. That looks like a 36.4% increase. To see more information click here: Todays chart for HIMS.
The chart on the right shows what we saw 8 trading days ago. The green arrows on the chart mark the point that we took interest. |
 |
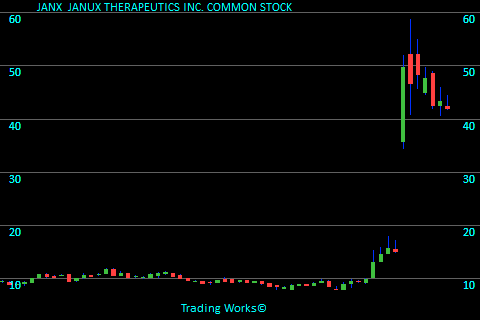
JANXJANUX THERAPEUTICS INC. COMMON STOCK
JANX is part of the Biotechnology sector. A few days back JANX showed up on our stock radar because it showed itself rising nicely. The stock ended trading at $13.14. For this chart, the closing price is $41.90 meaning the stock advanced by $28.76 per share. This banks in at a 218.9% increase. To see more information click here: Todays chart for JANX.
The chart on the right shows what we saw 11 trading days ago. The green arrows on the chart mark the point that we took interest. |
 |
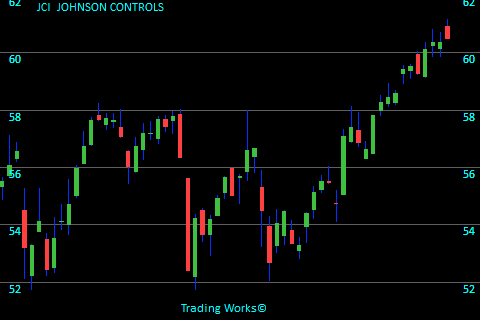
JCIJOHNSON CONTROLS
JCI is in the Building Products & Equipment sector. Not so long ago JCI showed up on our stock radar on this day because the closing price finished higher than previous averages. The stock ended trading at $58.58. Looking at this chart we see the final price is $60.49 meaning the stock rose $1.91 per share. That equates to a 3.3% increase. To see more information click here: Todays chart for JCI.
The chart on the right shows what we saw 8 trading days ago. The green arrows on the chart mark the point that we took interest. |
 |
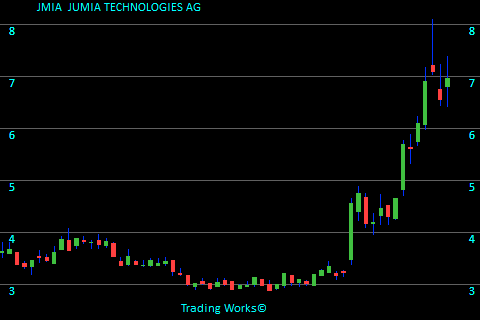
JMIAJUMIA TECHNOLOGIES AG
JMIA is categorized in the Internet Retail sector. At the end of the trading day 14 days ago JMIA became attention worthy because it has moved up sharply in recent days. The stock closed back then at $4.56. Referring to the chart here, the last price is $6.96 meaning the stock went up $2.40 per share. This banks in at a 52.6% increase. To see more information click here: Todays chart for JMIA.
The chart on the right shows what we saw 14 trading days ago. The green arrows on the chart mark the point that we took interest. |
 |
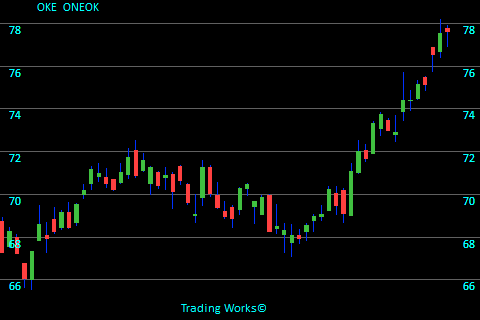
OKEONEOK
OKE belongs to the Oil & Gas Midstream sector. Not long ago OKE deserved some scrutiny because the price increase was exceeding the expected pace. The stock finished trading at $73.33. The last closing price on this chart is $77.62 meaning the stock moved up $4.29 per share. This banks in at a 5.9% increase. To see more information click here: Todays chart for OKE.
The chart on the right shows what we saw 11 trading days ago. The green arrows on the chart mark the point that we took interest. |
 |
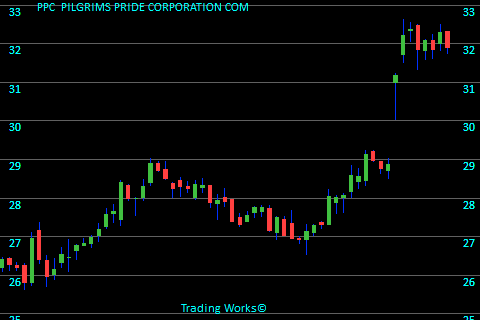
PPCPILGRIMS PRIDE CORPORATION COM
PPC fits in the Packaged Foods sector. Recently PPC caught our attention because the stock is holding above the previous trading range. The stock finished trading at $31.19. The last closing price on this chart is $31.91 meaning the stock had risen by $0.72 per share. That looks like a 2.3% increase. To see more information click here: Todays chart for PPC.
The chart on the right shows what we saw 8 trading days ago. The green arrows on the chart mark the point that we took interest. |
 |
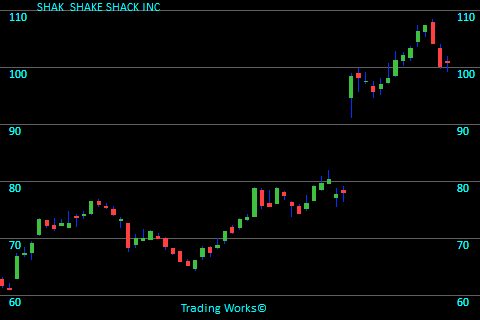
SHAKSHAKE SHACK INC
SHAK belongs to the Restaurants sector. Recently SHAK showed up on our stock radar since it jumped in value recently. The stock ended trading at $98.40. The last closing price on this chart is $100.93 meaning the stock increased by $2.53 per share. That equates to a 2.6% increase. To see more information click here: Todays chart for SHAK.
The chart on the right shows what we saw 14 trading days ago. The green arrows on the chart mark the point that we took interest. |
 |
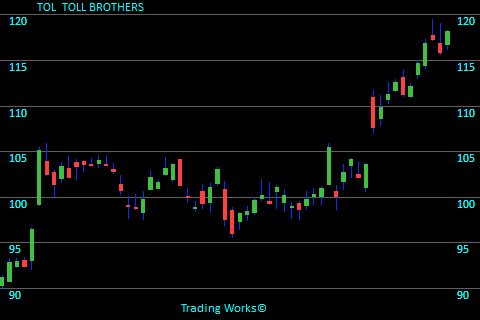
TOLTOLL BROTHERS
TOL is categorized in the Residential Construction sector. It was 11 days ago that TOL deserved some scrutiny because it has gained strength. The stock closed back then at $107.64. Looking at this chart we see the final price is $118.14 meaning the stock had risen by $10.50 per share. This works out to a 9.8% increase. To see more information click here: Todays chart for TOL.
The chart on the right shows what we saw 11 trading days ago. The green arrows on the chart mark the point that we took interest. |
 |
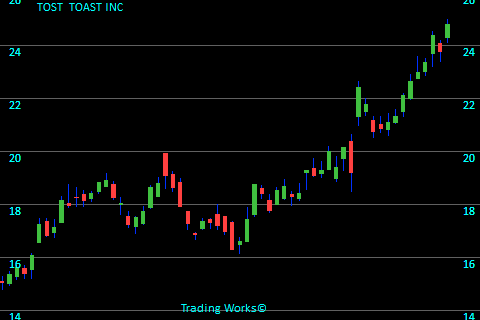
TOSTTOAST INC
TOST is categorized under the Software - Infrastructure sector. At the end of the trading day 8 days ago TOST showed up on our stock radar due to the fact it had a good improvement in its price. The stock ended trading at $21.34. The last closing price on this chart is $24.80 meaning the stock climbed by $3.46 per share. That equates to a 16.2% increase. To see more information click here: Todays chart for TOST.
The chart on the right shows what we saw 8 trading days ago. The green arrows on the chart mark the point that we took interest. |
 |
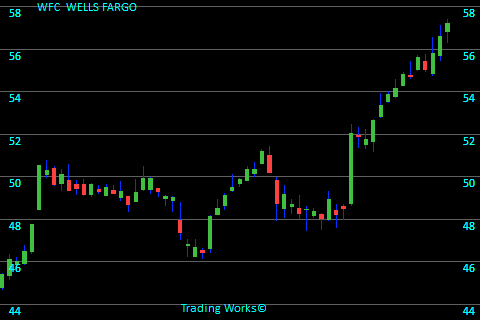
WFCWELLS FARGO
WFC is categorized under the Banks - Diversified sector. Just 14 days ago WFC caught our attention because it showed itself rising nicely. The stock finished trading at $52.04. The last closing price on this chart is $57.21 meaning the stock had risen by $5.17 per share. This works out to a 9.9% increase. To see more information click here: Todays chart for WFC.
The chart on the right shows what we saw 14 trading days ago. The green arrows on the chart mark the point that we took interest. |
 |
Trading stats for this day:
Total Value of stocks tracked is $89.3 Trillion.
Total Value recently traded was $547 Billion.
Total Value of Options traded (in our zone) was $2.6 Billion.
9,879,615 Call volume.
4,879,190 Put volume.
Blog Index
 © publishing since 2005.