 |
Blog on Stocks for March 1, 2024.
These stocks appeared on one of our screening reports approximately 10 trading days ago and are further
limited to ones that have some Stock-Options (Calls and Puts) with decent trading volume.
We provide these for education purposes only and not making a recommendation... especially on a delayed report.
We are just helping you see what you can do in a few short minutes per day.

Blog Index
|
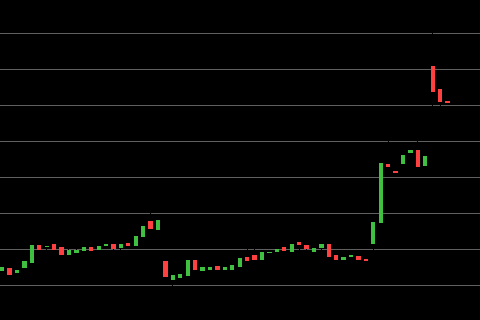
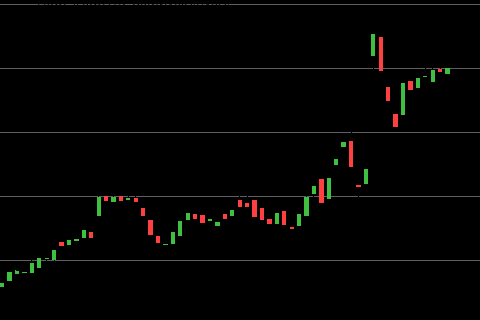
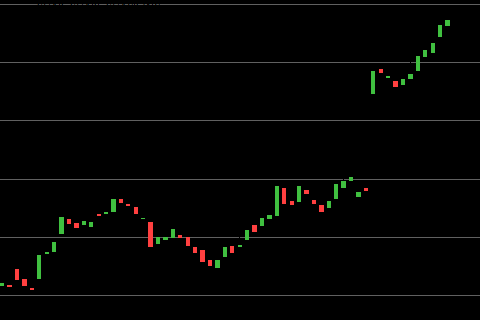
APLTAPPLIED THERAPEUTICS INC
APLT belongs to the Biotechnology sector. It was 11 days ago that APLT deserved some scrutiny because it has gained strength. The stock closed back then at $3.75. The last closing price on this chart is $7.07 meaning the stock climbed by $3.32 per share. That equates to a 88.5% increase. To see more information click here: Todays chart for APLT.
The chart on the right shows what we saw 11 trading days ago. The green arrows on the chart mark the point that we took interest. |
 |
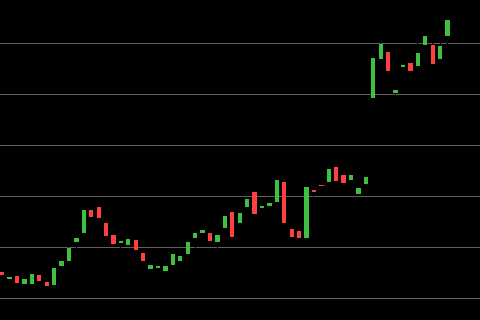
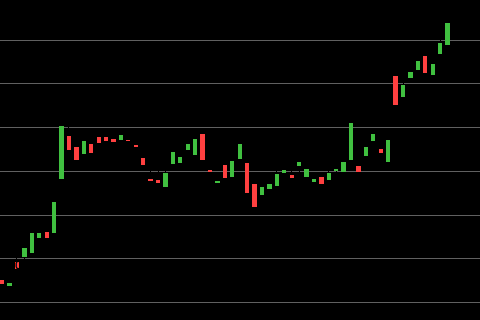
APPAPPLOVIN CORPORATION CLASS A
APP is linked with the Software - Application sector. Not so long ago APP caused us to review the chart because the stock is holding above the previous trading range. The stock closed on that day at $58.50. At the time of this blog, the attached chart show a last price of $62.26 meaning the stock rose $3.76 per share. It computes to a 6.4% increase. To see more information click here: Todays chart for APP.
The chart on the right shows what we saw 11 trading days ago. The green arrows on the chart mark the point that we took interest. |
 |
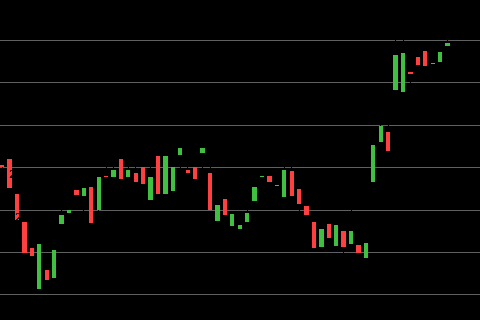
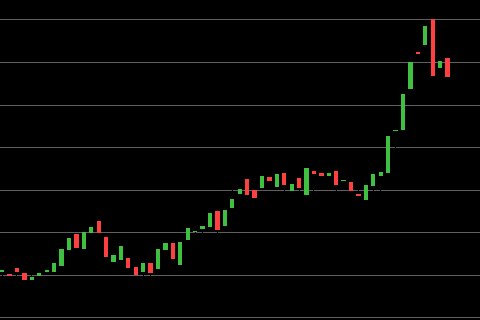
ARANTERO RESOURCES CORP
AR belongs to the Oil & Gas E&P sector. It was 8 days ago that AR gave us a reason to review the charts since it jumped in value recently. The stock closed on that day at $25.63. At the time of this blog, the attached chart show a last price of $25.92 meaning the stock moved up $0.29 per share. It computes to a 1.1% increase. To see more information click here: Todays chart for AR.
The chart on the right shows what we saw 8 trading days ago. The green arrows on the chart mark the point that we took interest. |
 |
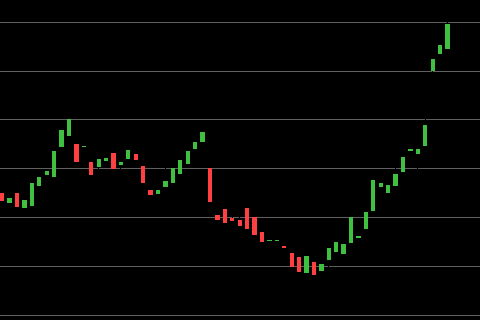
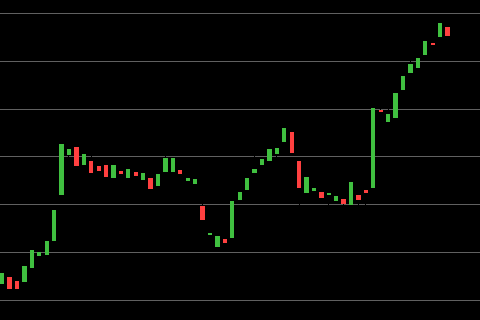
CPNGCOUPANG INC
CPNG stands in the Internet Retail sector. Only a few days ago CPNG caught our attention because it has moved up sharply in recent days. The stock ended trading at $15.76. Looking at this chart we see the final price is $18.95 meaning the stock climbed by $3.19 per share. It computes to a 20.2% increase. To see more information click here: Todays chart for CPNG.
The chart on the right shows what we saw 11 trading days ago. The green arrows on the chart mark the point that we took interest. |
 |
FROGJFROG LTD. ORDINARY SHARES
FROG belongs to the Software - Application sector. Recently FROG gave us a reason to review the charts There is no guarantee that it will rise, but it's certainly worth watching. To see more information click here: Todays chart for FROG.
The chart on the right shows what we saw 11 trading days ago. The green arrows on the chart mark the point that we took interest. |
 |
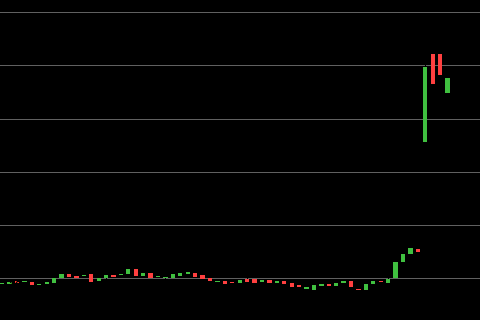
JANXJANUX THERAPEUTICS INC. COMMON STOCK
JANX is categorized in the Biotechnology sector. Recently (8 days ago) JANX showed up on our stock radar because it has gained strength. The stock finished trading at $13.14. At the time of this blog, the attached chart show a last price of $47.67 meaning the stock moved up $34.53 per share. That equates to a 262.8% increase. To see more information click here: Todays chart for JANX.
The chart on the right shows what we saw 8 trading days ago. The green arrows on the chart mark the point that we took interest. |
 |
OKEONEOK
OKE is in the Oil & Gas Midstream sector. Not long ago OKE deserved some scrutiny because it looks like an emerging opportunity. The stock closed for that day at $73.33. Looking at this chart we see the final price is $75.13 meaning the stock advanced by $1.80 per share. This banks in at a 2.5% increase. To see more information click here: Todays chart for OKE.
The chart on the right shows what we saw 8 trading days ago. The green arrows on the chart mark the point that we took interest. |
 |
SANASANA BIOTECHNOLOGY INC
SANA is grouped in the Biotechnology sector. Recently SANA grabbed 10 seconds of our time because it looks like an emerging opportunity. The stock closed back then at $8.52. For this chart, the closing price is $11.27 meaning the stock had risen by $2.75 per share. This banks in at a 32.3% increase. To see more information click here: Todays chart for SANA.
The chart on the right shows what we saw 11 trading days ago. The green arrows on the chart mark the point that we took interest. |
 |
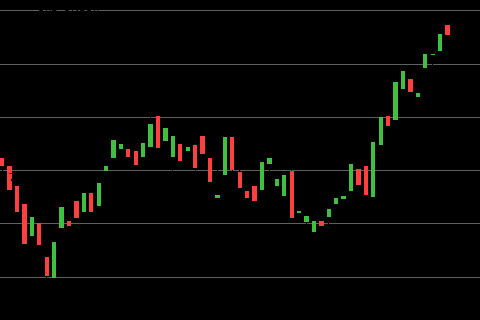
SHAKSHAKE SHACK INC
SHAK is associated with the Restaurants sector. Recently SHAK became attention worthy because this stock gained strength. The stock closed on that day at $98.40. The last closing price on this chart is $107.25 meaning the stock rose $8.85 per share. That looks like a 9.0% increase. To see more information click here: Todays chart for SHAK.
The chart on the right shows what we saw 11 trading days ago. The green arrows on the chart mark the point that we took interest. |
 |
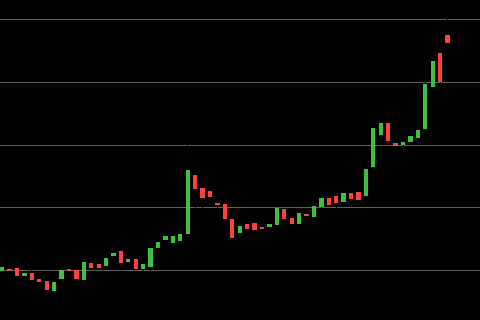
TOLTOLL BROTHERS
TOL is linked with the Residential Construction sector. Recently (8 days ago) TOL deserved some scrutiny because this stock gained strength. The stock ended trading at $107.64. At the time of this blog, the attached chart show a last price of $116.92 meaning the stock increased by $9.28 per share. This banks in at a 8.6% increase. To see more information click here: Todays chart for TOL.
The chart on the right shows what we saw 8 trading days ago. The green arrows on the chart mark the point that we took interest. |
 |
TRAKREPOSITRAK
TRAK is associated with the Software - Application sector. Recently TRAK deserved some scrutiny because the price increase was exceeding the expected pace. The stock closed back then at $13.41. Referring to the chart here, the last price is $14.68 meaning the stock climbed by $1.27 per share. This works out to a 9.5% increase. To see more information click here: Todays chart for TRAK.
The chart on the right shows what we saw 8 trading days ago. The green arrows on the chart mark the point that we took interest. |
 |
WFCWELLS FARGO
WFC stands in the Banks - Diversified sector. Not long ago WFC popped up on our screen on this day because the closing price finished higher than previous averages. The stock finished trading at $52.04. Referring to the chart here, the last price is $55.06 meaning the stock advanced by $3.02 per share. It computes to a 5.8% increase. To see more information click here: Todays chart for WFC.
The chart on the right shows what we saw 11 trading days ago. The green arrows on the chart mark the point that we took interest. |
 |
Trading stats for this day:
Total Value of stocks tracked is $89.7 Trillion.
Total Value recently traded was $534 Billion.
Total Value of Options traded (in our zone) was $5.7 Billion.
10,756,234 Call volume.
5,530,875 Put volume.
Blog Index
 © publishing since 2005.