 |
Blog on Stocks for February 28, 2024.
These stocks appeared on one of our screening reports approximately 10 trading days ago and are further
limited to ones that have some Stock-Options (Calls and Puts) with decent trading volume.
We provide these for education purposes only and not making a recommendation... especially on a delayed report.
We are just helping you see what you can do in a few short minutes per day.

Blog Index
|
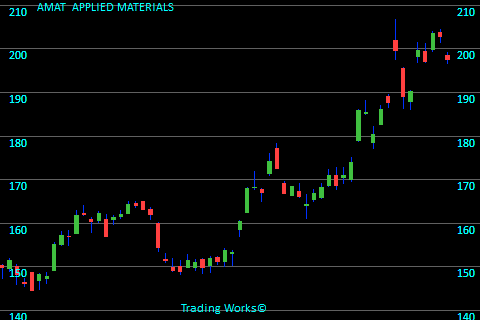
AMATAPPLIED MATERIALS
AMAT is in the Semiconductor Equipment & Materials sector. Just 14 days ago AMAT popped up on our screen because the price increase was exceeding the expected pace. The stock closed on that day at $173.89. The last closing price on this chart is $197.66 meaning the stock had risen by $23.77 per share. It computes to a 13.7% increase. To see more information click here: Todays chart for AMAT.
The chart on the right shows what we saw 14 trading days ago. The green arrows on the chart mark the point that we took interest. |
 |
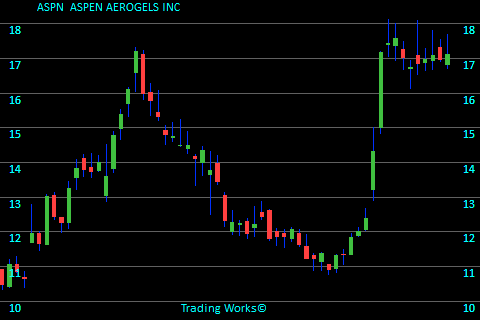
ASPNASPEN AEROGELS INC
ASPN fits in the Building Products & Equipment sector. Recently ASPN gave us a reason to review the charts due to the fact it had a good improvement in its price. The stock closed back then at $14.33. The last closing price on this chart is $17.11 meaning the stock had risen by $2.78 per share. That equates to a 19.4% increase. To see more information click here: Todays chart for ASPN.
The chart on the right shows what we saw 11 trading days ago. The green arrows on the chart mark the point that we took interest. |
 |
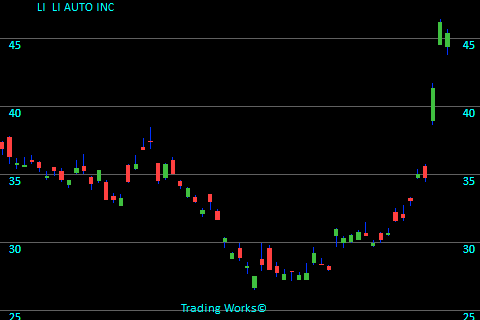
LILI AUTO INC
LI belongs to the Auto Manufacturers sector. Only 8 days ago LI showed up on our stock radar because it was showing upward strength in the price. The stock closed on that day at $31.64. For this chart, the closing price is $45.42 meaning the stock moved up $13.78 per share. It computes to a 43.6% increase. To see more information click here: Todays chart for LI.
The chart on the right shows what we saw 8 trading days ago. The green arrows on the chart mark the point that we took interest. |
 |
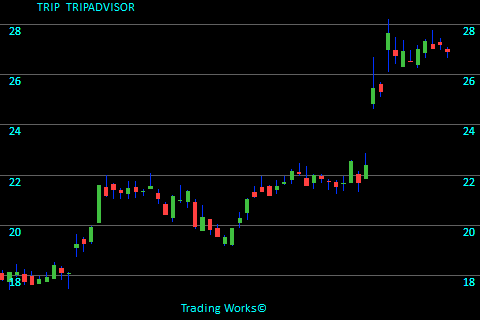
TRIPTRIPADVISOR
TRIP fits in the Travel Services sector. Recently TRIP popped up on our screen since its price was progressing well. The stock closed back then at $25.46. For this chart, the closing price is $26.91 meaning the stock rose $1.45 per share. This banks in at a 5.7% increase. To see more information click here: Todays chart for TRIP.
The chart on the right shows what we saw 11 trading days ago. The green arrows on the chart mark the point that we took interest. |
 |
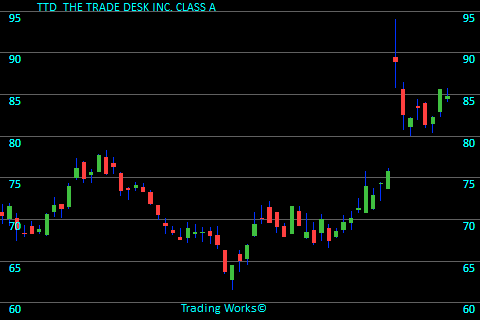
TTDTHE TRADE DESK INC. CLASS A
TTD belongs to the Software - Application sector. Only 8 days ago TTD caught our attention There is no guarantee that it will rise, but it's certainly worth watching. To see more information click here: Todays chart for TTD.
The chart on the right shows what we saw 8 trading days ago. The green arrows on the chart mark the point that we took interest. |
 |
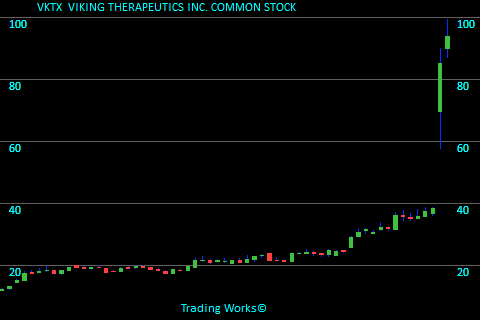
VKTXVIKING THERAPEUTICS INC. COMMON STOCK
VKTX is categorized in the Biotechnology sector. It was 14 days ago that VKTX grabbed 10 seconds of our time because this stock gained strength. The stock ended trading at $28.89. For this chart, the closing price is $93.79 meaning the stock advanced by $64.90 per share. It computes to a 224.6% increase. To see more information click here: Todays chart for VKTX.
The chart on the right shows what we saw 14 trading days ago. The green arrows on the chart mark the point that we took interest. |
 |
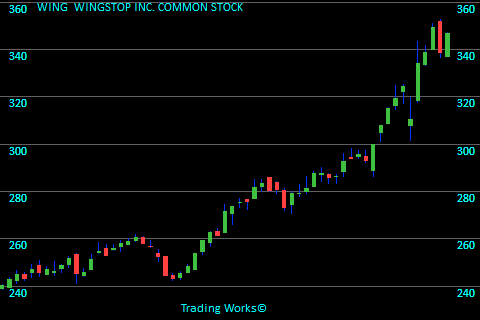
WINGWINGSTOP INC. COMMON STOCK
WING belongs to the Restaurants sector. At the end of the trading day 11 days ago WING showed up on our stock radar because the price increase was exceeding the expected pace. The stock finished trading at $299.97. Referring to the chart here, the last price is $346.65 meaning the stock had risen by $46.68 per share. This banks in at a 15.6% increase. To see more information click here: Todays chart for WING.
The chart on the right shows what we saw 11 trading days ago. The green arrows on the chart mark the point that we took interest. |
 |
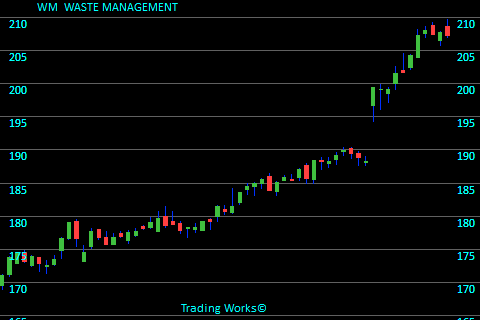
WMWASTE MANAGEMENT
WM is in the Waste Management sector. Not so long ago WM popped up on our screen because the price increase was exceeding the expected pace. The stock finished trading at $199.49. The last closing price on this chart is $207.26 meaning the stock increased by $7.77 per share. That equates to a 3.9% increase. To see more information click here: Todays chart for WM.
The chart on the right shows what we saw 11 trading days ago. The green arrows on the chart mark the point that we took interest. |
 |
Trading stats for this day:
Total Value of stocks tracked is $88.2 Trillion.
Total Value recently traded was $434 Billion.
Total Value of Options traded (in our zone) was $2.5 Billion.
6,255,784 Call volume.
2,909,338 Put volume.
Blog Index
 © publishing since 2005.