 |
Blog on Stocks for February 26, 2024.
These stocks appeared on one of our screening reports approximately 10 trading days ago and are further
limited to ones that have some Stock-Options (Calls and Puts) with decent trading volume.
We provide these for education purposes only and not making a recommendation... especially on a delayed report.
We are just helping you see what you can do in a few short minutes per day.

Blog Index
|
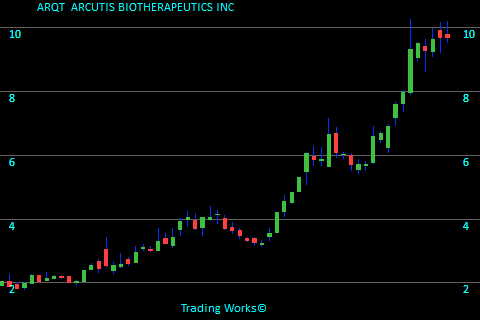
ARQTARCUTIS BIOTHERAPEUTICS INC
ARQT is linked with the Biotechnology sector. A few days back ARQT deserved some scrutiny because the stock is holding above the previous trading range. The stock ended trading at $6.57. Looking at this chart we see the final price is $9.69 meaning the stock moved up $3.12 per share. This works out to a 47.5% increase. To see more information click here: Todays chart for ARQT.
The chart on the right shows what we saw 11 trading days ago. The green arrows on the chart mark the point that we took interest. |
 |
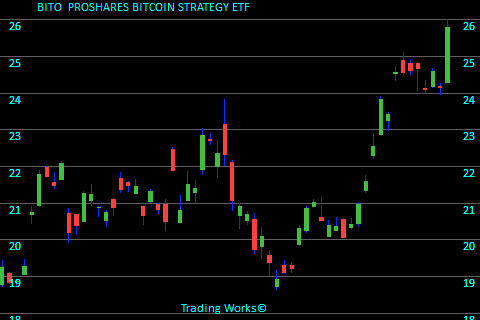
BITOPROSHARES BITCOIN STRATEGY ETF
Just 11 days ago BITO was listed in our Strong Trend report because it has gained strength. The stock ended trading at $22.54. For this chart, the closing price is $25.80 meaning the stock climbed by $3.26 per share. That looks like a 14.5% increase. To see more information click here: Todays chart for BITO.
The chart on the right shows what we saw 11 trading days ago. The green arrows on the chart mark the point that we took interest. |
 |
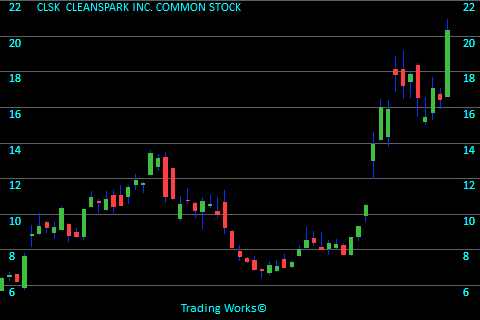
CLSKCLEANSPARK INC. COMMON STOCK
CLSK is in the Capital Markets sector. Recently CLSK gave us a reason to review the charts because it has gained strength. The stock finished trading at $13.95. At the time of this blog, the attached chart show a last price of $20.35 meaning the stock went up $6.40 per share. That equates to a 45.9% increase. To see more information click here: Todays chart for CLSK.
The chart on the right shows what we saw 11 trading days ago. The green arrows on the chart mark the point that we took interest. |
 |
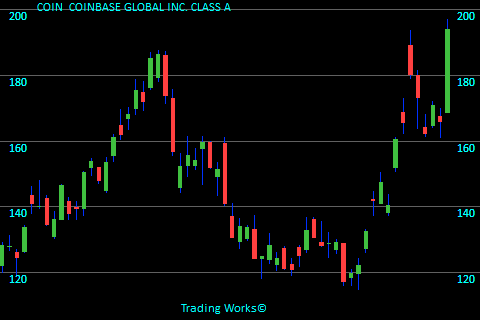
COINCOINBASE GLOBAL INC. CLASS A
COIN fits in the Financial Data & Stock Exchanges sector. Only 8 days ago COIN grabbed 10 seconds of our time since its price was progressing well. The stock closed back then at $160.38. Looking at this chart we see the final price is $193.94 meaning the stock advanced by $33.56 per share. That equates to a 20.9% increase. To see more information click here: Todays chart for COIN.
The chart on the right shows what we saw 8 trading days ago. The green arrows on the chart mark the point that we took interest. |
 |
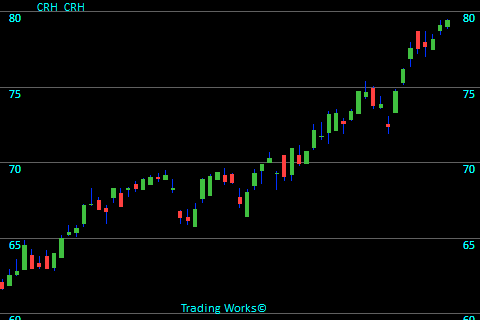
CRHCRH
CRH is related to the Building Materials sector. It was 8 days ago that CRH caught our attention since it jumped in value recently. The stock closed on that day at $74.75. For this chart, the closing price is $79.42 meaning the stock rose $4.67 per share. That looks like a 6.2% increase. To see more information click here: Todays chart for CRH.
The chart on the right shows what we saw 8 trading days ago. The green arrows on the chart mark the point that we took interest. |
 |
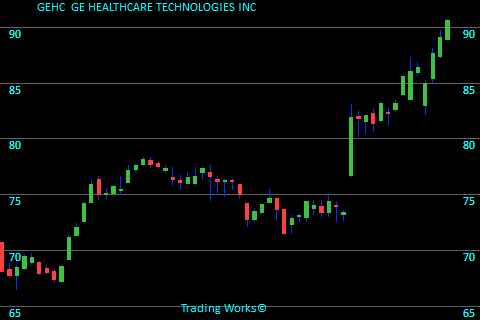
GEHCGE HEALTHCARE TECHNOLOGIES INC
GEHC is categorized under the Health Information Services sector. A few days back GEHC popped up on our screen since its price was progressing well. The stock closed back then at $81.96. The last closing price on this chart is $90.62 meaning the stock rose $8.66 per share. That calculates in at a 10.6% increase. To see more information click here: Todays chart for GEHC.
The chart on the right shows what we saw 14 trading days ago. The green arrows on the chart mark the point that we took interest. |
 |
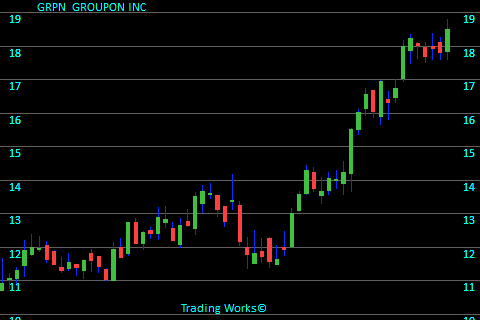
GRPNGROUPON INC
GRPN belongs to the Internet Content & Information sector. It was 14 days ago that GRPN gave us a reason to review the charts because it showed itself rising nicely. The stock closed on that day at $15.52. Referring to the chart here, the last price is $18.51 meaning the stock moved up $2.99 per share. That calculates in at a 19.3% increase. To see more information click here: Todays chart for GRPN.
The chart on the right shows what we saw 14 trading days ago. The green arrows on the chart mark the point that we took interest. |
 |
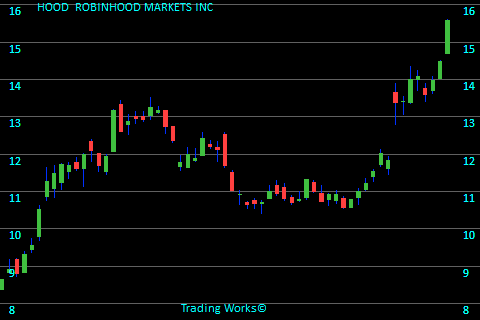
HOODROBINHOOD MARKETS INC
HOOD is part of the Capital Markets sector. Not so long ago HOOD became attention worthy because this stock gained strength. The stock finished trading at $13.38. For this chart, the closing price is $15.59 meaning the stock rose $2.21 per share. This works out to a 16.5% increase. To see more information click here: Todays chart for HOOD.
The chart on the right shows what we saw 8 trading days ago. The green arrows on the chart mark the point that we took interest. |
 |
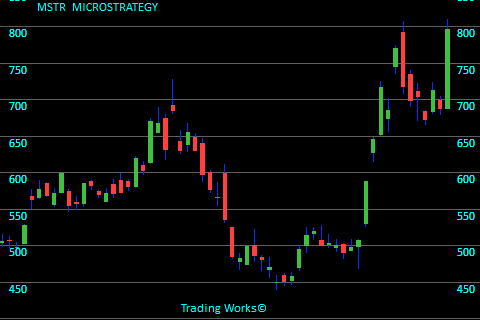
MSTRMICROSTRATEGY
MSTR is associated with the Software - Application sector. Not long ago MSTR was listed in our Strong Trend report because it was showing upward strength in the price. The stock closed for that day at $646.32. At the time of this blog, the attached chart show a last price of $796.48 meaning the stock climbed by $150.16 per share. This works out to a 23.2% increase. To see more information click here: Todays chart for MSTR.
The chart on the right shows what we saw 11 trading days ago. The green arrows on the chart mark the point that we took interest. |
 |
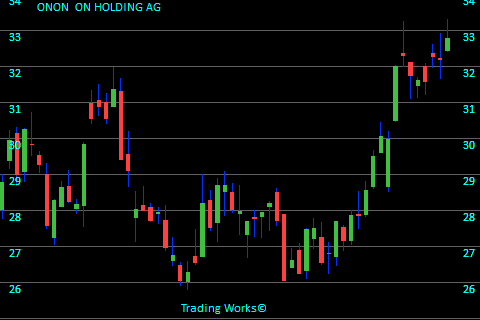
ONONON HOLDING AG
ONON fits in the Footwear & Accessories sector. It was 8 days ago that ONON showed up on our stock radar because the stock is holding above the previous trading range. The stock closed for that day at $32.01. The last closing price on this chart is $32.78 meaning the stock had risen by $0.77 per share. That calculates in at a 2.4% increase. To see more information click here: Todays chart for ONON.
The chart on the right shows what we saw 8 trading days ago. The green arrows on the chart mark the point that we took interest. |
 |
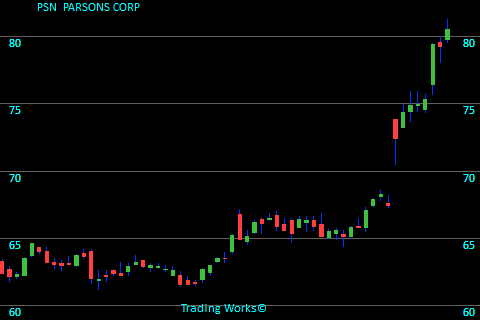
PSNPARSONS CORP
PSN stands in the Information Technology Services sector. A few days back PSN grabbed 10 seconds of our time because this stock gained strength. The stock finished trading at $72.41. Referring to the chart here, the last price is $80.53 meaning the stock had risen by $8.12 per share. That equates to a 11.2% increase. To see more information click here: Todays chart for PSN.
The chart on the right shows what we saw 8 trading days ago. The green arrows on the chart mark the point that we took interest. |
 |
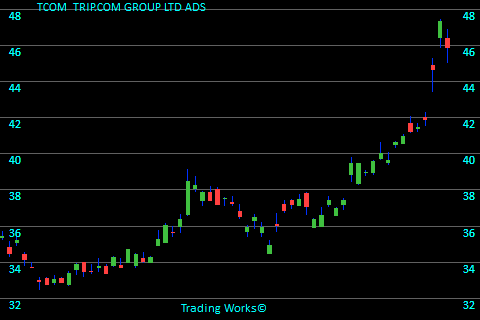
TCOMTRIP.COM GROUP LTD ADS
TCOM is associated with the Travel Services sector. A few days back TCOM gave us a reason to review the charts since it jumped in value recently. The stock ended trading at $39.48. The last closing price on this chart is $45.90 meaning the stock moved up $6.42 per share. That calculates in at a 16.3% increase. To see more information click here: Todays chart for TCOM.
The chart on the right shows what we saw 14 trading days ago. The green arrows on the chart mark the point that we took interest. |
 |
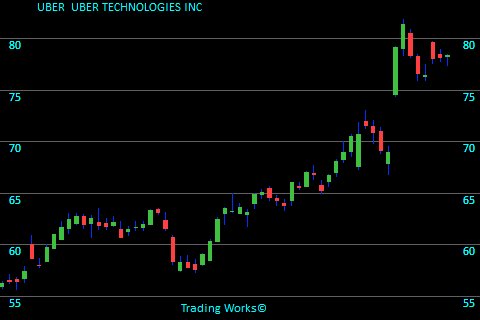
UBERUBER TECHNOLOGIES INC
UBER is part of the Software - Application sector. Recently UBER caught our attention There is no guarantee that it will rise, but it's certainly worth watching. To see more information click here: Todays chart for UBER.
The chart on the right shows what we saw 8 trading days ago. The green arrows on the chart mark the point that we took interest. |
 |
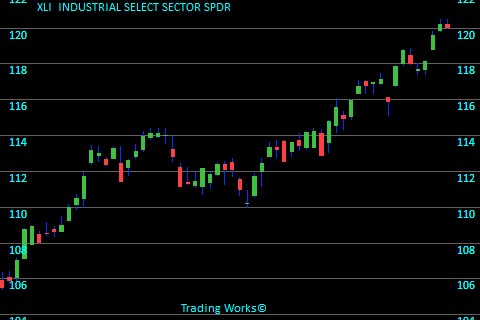
XLIINDUSTRIAL SELECT SECTOR SPDR
Recently XLI popped up on our screen because the stock is holding above the previous trading range. The stock ended trading at $117.86. Referring to the chart here, the last price is $120.04 meaning the stock had risen by $2.18 per share. This banks in at a 1.8% increase. To see more information click here: Todays chart for XLI.
The chart on the right shows what we saw 8 trading days ago. The green arrows on the chart mark the point that we took interest. |
 |
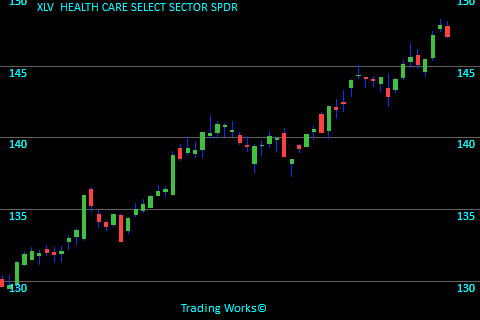
XLVHEALTH CARE SELECT SECTOR SPDR
Not so long ago XLV became attention worthy since it jumped in value recently. The stock closed on that day at $144.10. Referring to the chart here, the last price is $147.08 meaning the stock increased by $2.98 per share. That looks like a 2.1% increase. To see more information click here: Todays chart for XLV.
The chart on the right shows what we saw 8 trading days ago. The green arrows on the chart mark the point that we took interest. |
 |
Trading stats for this day:
Total Value of stocks tracked is $88.3 Trillion.
Total Value recently traded was $537 Billion.
Total Value of Options traded (in our zone) was $1.1 Billion.
3,189,899 Call volume.
1,339,938 Put volume.
Blog Index
 © publishing since 2005.