 |
Blog on Stocks for February 22, 2024.
These stocks appeared on one of our screening reports approximately 10 trading days ago and are further
limited to ones that have some Stock-Options (Calls and Puts) with decent trading volume.
We provide these for education purposes only and not making a recommendation... especially on a delayed report.
We are just helping you see what you can do in a few short minutes per day.

Blog Index
|
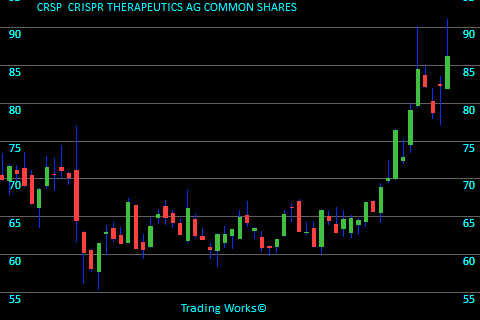
CRSPCRISPR THERAPEUTICS AG COMMON SHARES
CRSP is categorized in the Biotechnology sector. Only a few days ago CRSP showed up on our stock radar because it showed itself rising nicely. The stock ended trading at $76.44. Looking at this chart we see the final price is $86.22 meaning the stock climbed by $9.78 per share. That calculates in at a 12.8% increase. To see more information click here: Todays chart for CRSP.
The chart on the right shows what we saw 8 trading days ago. The green arrows on the chart mark the point that we took interest. |
 |
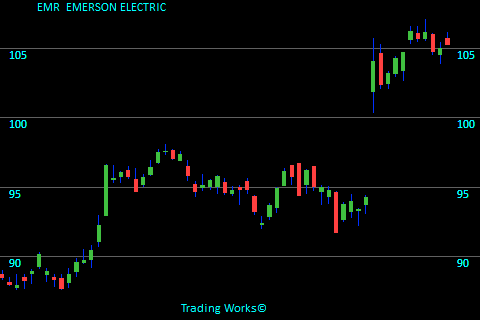
EMREMERSON ELECTRIC
EMR is associated with the Specialty Industrial Machinery sector. Not so long ago EMR became attention worthy because it has moved up sharply in recent days. The stock closed back then at $104.09. Referring to the chart here, the last price is $105.29 meaning the stock went up $1.20 per share. This banks in at a 1.2% increase. To see more information click here: Todays chart for EMR.
The chart on the right shows what we saw 11 trading days ago. The green arrows on the chart mark the point that we took interest. |
 |
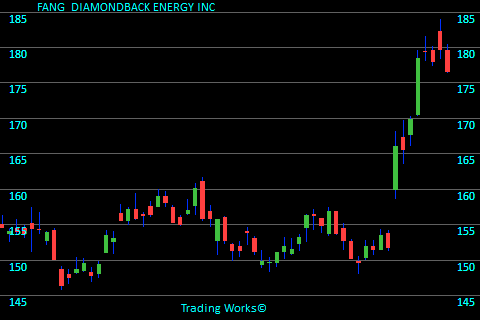
FANGDIAMONDBACK ENERGY INC
FANG is part of the Oil & Gas E&P sector. Recently (8 days ago) FANG showed up on our stock radar on this day because the closing price finished higher than previous averages. The stock closed back then at $165.98. Referring to the chart here, the last price is $176.57 meaning the stock moved up $10.59 per share. It computes to a 6.4% increase. To see more information click here: Todays chart for FANG.
The chart on the right shows what we saw 8 trading days ago. The green arrows on the chart mark the point that we took interest. |
 |
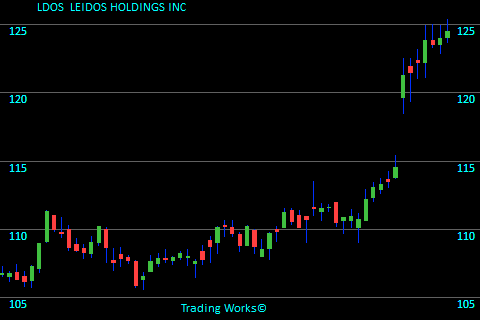
LDOSLEIDOS HOLDINGS INC
LDOS stands in the Information Technology Services sector. Recently (8 days ago) LDOS gave us a reason to review the charts because it has gained strength. The stock closed back then at $114.56. The last closing price on this chart is $124.49 meaning the stock increased by $9.93 per share. This works out to a 8.7% increase. To see more information click here: Todays chart for LDOS.
The chart on the right shows what we saw 8 trading days ago. The green arrows on the chart mark the point that we took interest. |
 |
Trading stats for this day:
Total Value of stocks tracked is $88.8 Trillion.
Total Value recently traded was $558 Billion.
Total Value of Options traded (in our zone) was $1.8 Billion.
4,116,824 Call volume.
2,759,425 Put volume.
Blog Index
 © publishing since 2005.