 |
Blog on Stocks for February 21, 2024.
These stocks appeared on one of our screening reports approximately 10 trading days ago and are further
limited to ones that have some Stock-Options (Calls and Puts) with decent trading volume.
We provide these for education purposes only and not making a recommendation... especially on a delayed report.
We are just helping you see what you can do in a few short minutes per day.

Blog Index
|
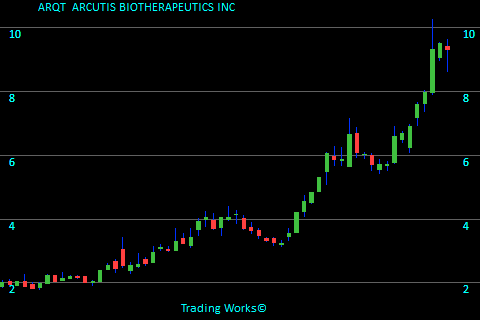
ARQTARCUTIS BIOTHERAPEUTICS INC
ARQT is grouped in the Biotechnology sector. Recently ARQT gave us a reason to review the charts since it jumped in value recently. The stock closed back then at $6.57. Referring to the chart here, the last price is $9.29 meaning the stock had risen by $2.72 per share. It computes to a 41.4% increase. To see more information click here: Todays chart for ARQT.
The chart on the right shows what we saw 8 trading days ago. The green arrows on the chart mark the point that we took interest. |
 |
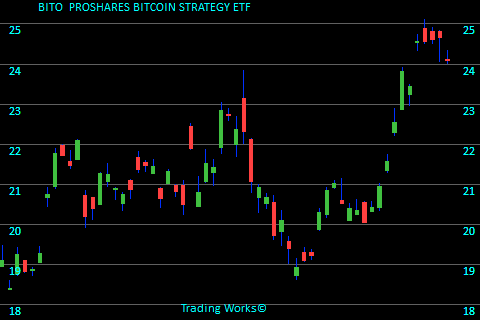
BITOPROSHARES BITCOIN STRATEGY ETF
At the end of the trading day 8 days ago BITO gave us a reason to review the charts because it has moved up sharply in recent days. The stock closed back then at $22.54. At the time of this blog, the attached chart show a last price of $24.08 meaning the stock went up $1.54 per share. This works out to a 6.8% increase. To see more information click here: Todays chart for BITO.
The chart on the right shows what we saw 8 trading days ago. The green arrows on the chart mark the point that we took interest. |
 |
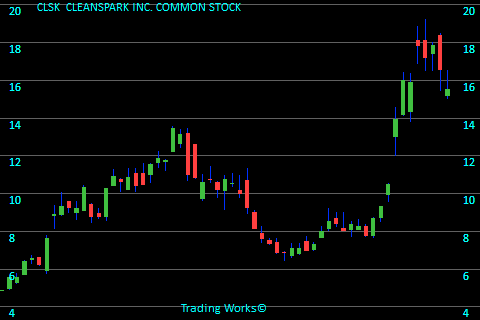
CLSKCLEANSPARK INC. COMMON STOCK
CLSK stands in the Capital Markets sector. At the end of the trading day 8 days ago CLSK was listed in our Strong Trend report because it looks like an emerging opportunity. The stock closed for that day at $13.95. For this chart, the closing price is $15.52 meaning the stock rose $1.57 per share. This works out to a 11.3% increase. To see more information click here: Todays chart for CLSK.
The chart on the right shows what we saw 8 trading days ago. The green arrows on the chart mark the point that we took interest. |
 |
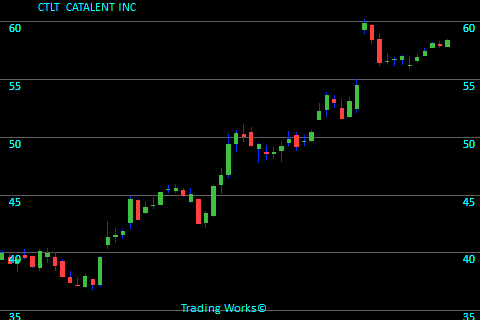
CTLTCATALENT INC
CTLT is in the Drug Manufacturers - Specialty & Generic sector. Just 14 days ago CTLT was listed in our Strong Trend report because this stock gained strength. The stock finished trading at $53.09. At the time of this blog, the attached chart show a last price of $58.41 meaning the stock gained $5.32 per share. That equates to a 10.0% increase. To see more information click here: Todays chart for CTLT.
The chart on the right shows what we saw 14 trading days ago. The green arrows on the chart mark the point that we took interest. |
 |
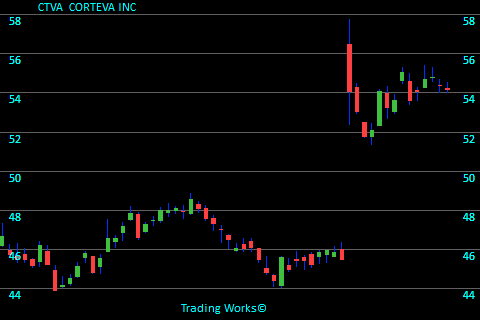
CTVACORTEVA INC
CTVA is related to the Agricultural Inputs sector. Not so long ago CTVA was listed in our Strong Trend report because it has gained strength. The stock finished trading at $54.06. The last closing price on this chart is $54.19 meaning the stock had risen by $0.13 per share. That equates to a 0.2% increase. To see more information click here: Todays chart for CTVA.
The chart on the right shows what we saw 14 trading days ago. The green arrows on the chart mark the point that we took interest. |
 |
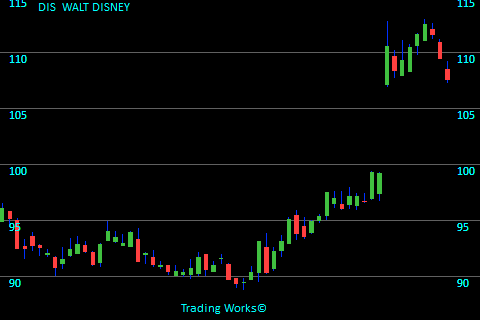
DISWALT DISNEY
DIS is associated with the Entertainment sector. It was 11 days ago that DIS deserved some scrutiny because it was showing upward strength in the price. The stock closed on that day at $99.29. For this chart, the closing price is $107.58 meaning the stock climbed by $8.29 per share. This banks in at a 8.3% increase. To see more information click here: Todays chart for DIS.
The chart on the right shows what we saw 11 trading days ago. The green arrows on the chart mark the point that we took interest. |
 |
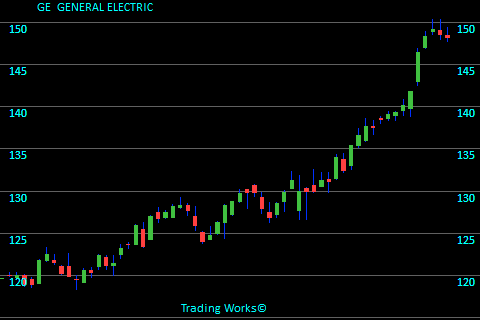
GEGENERAL ELECTRIC
GE is categorized in the Specialty Industrial Machinery sector. Only 14 days ago GE caught our attention since its price was progressing well. The stock closed back then at $135.41. The last closing price on this chart is $148.21 meaning the stock gained $12.80 per share. This banks in at a 9.5% increase. To see more information click here: Todays chart for GE.
The chart on the right shows what we saw 14 trading days ago. The green arrows on the chart mark the point that we took interest. |
 |
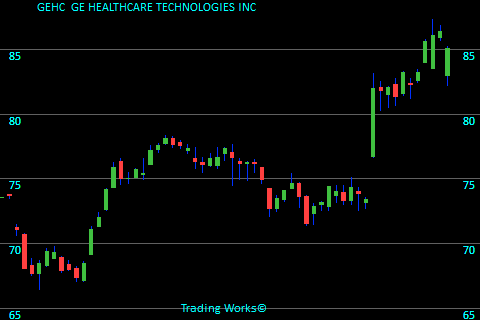
GEHCGE HEALTHCARE TECHNOLOGIES INC
GEHC is grouped in the Health Information Services sector. A few days back GEHC popped up on our screen since it jumped in value recently. The stock closed for that day at $81.96. Referring to the chart here, the last price is $85.04 meaning the stock went up $3.08 per share. This works out to a 3.8% increase. To see more information click here: Todays chart for GEHC.
The chart on the right shows what we saw 11 trading days ago. The green arrows on the chart mark the point that we took interest. |
 |
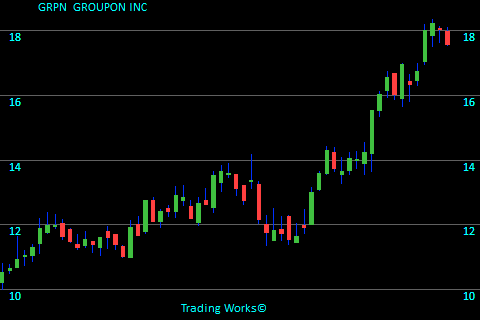
GRPNGROUPON INC
GRPN belongs to the Internet Content & Information sector. Recently (11 days ago) GRPN deserved some scrutiny on this day because the closing price finished higher than previous averages. The stock ended trading at $15.52. For this chart, the closing price is $17.57 meaning the stock had risen by $2.05 per share. That equates to a 13.2% increase. To see more information click here: Todays chart for GRPN.
The chart on the right shows what we saw 11 trading days ago. The green arrows on the chart mark the point that we took interest. |
 |
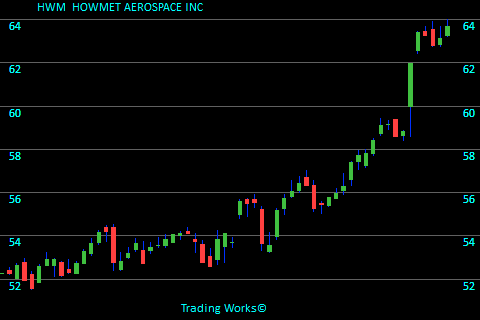
HWMHOWMET AEROSPACE INC
HWM is associated with the Aerospace & Defense sector. It was 14 days ago that HWM became attention worthy because it showed itself rising nicely. The stock closed for that day at $57.38. The last closing price on this chart is $63.67 meaning the stock moved up $6.29 per share. That equates to a 11.0% increase. To see more information click here: Todays chart for HWM.
The chart on the right shows what we saw 14 trading days ago. The green arrows on the chart mark the point that we took interest. |
 |
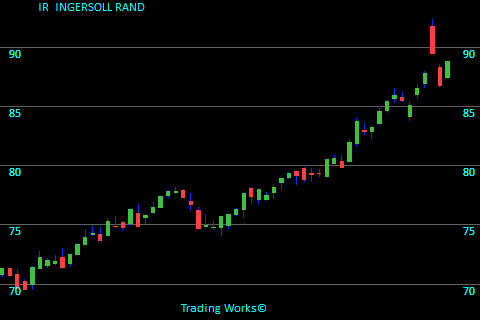
IRINGERSOLL RAND
IR is associated with the Specialty Industrial Machinery sector. Not long ago IR grabbed 10 seconds of our time because it showed itself rising nicely. The stock finished trading at $81.99. Looking at this chart we see the final price is $88.74 meaning the stock had risen by $6.75 per share. This works out to a 8.2% increase. To see more information click here: Todays chart for IR.
The chart on the right shows what we saw 14 trading days ago. The green arrows on the chart mark the point that we took interest. |
 |
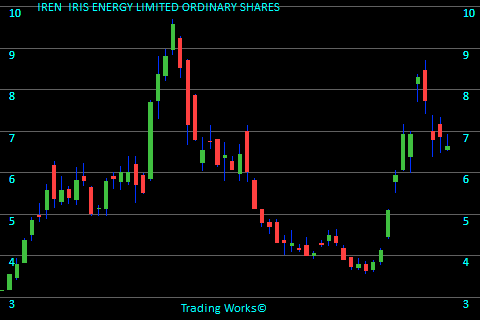
IRENIRIS ENERGY LIMITED ORDINARY SHARES
IREN is part of the Capital Markets sector. It was 8 days ago that IREN was listed in our Strong Trend report because it has moved up sharply in recent days. The stock closed back then at $5.94. At the time of this blog, the attached chart show a last price of $6.62 meaning the stock had risen by $0.68 per share. This banks in at a 11.4% increase. To see more information click here: Todays chart for IREN.
The chart on the right shows what we saw 8 trading days ago. The green arrows on the chart mark the point that we took interest. |
 |
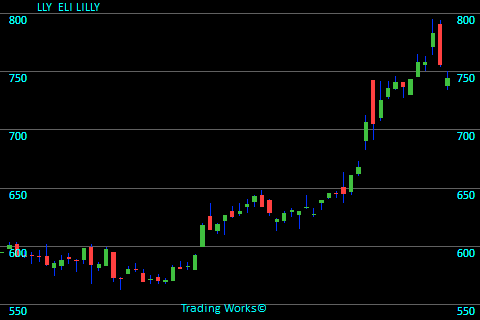
LLYELI LILLY
LLY is categorized under the Drug Manufacturers - General sector. Recently LLY grabbed 10 seconds of our time because it has gained strength. The stock closed on that day at $660.43. The last closing price on this chart is $743.79 meaning the stock moved up $83.36 per share. This works out to a 12.6% increase. To see more information click here: Todays chart for LLY.
The chart on the right shows what we saw 14 trading days ago. The green arrows on the chart mark the point that we took interest. |
 |
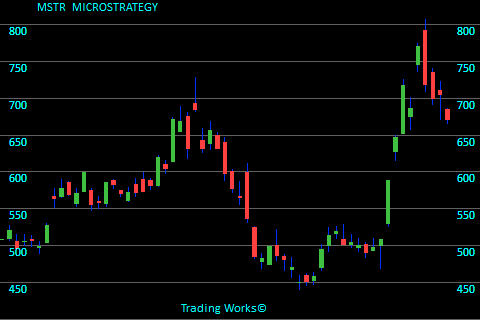
MSTRMICROSTRATEGY
MSTR is related to the Software - Application sector. It was 8 days ago that MSTR grabbed 10 seconds of our time since it jumped in value recently. The stock closed on that day at $646.32. For this chart, the closing price is $671.47 meaning the stock had risen by $25.15 per share. It computes to a 3.9% increase. To see more information click here: Todays chart for MSTR.
The chart on the right shows what we saw 8 trading days ago. The green arrows on the chart mark the point that we took interest. |
 |
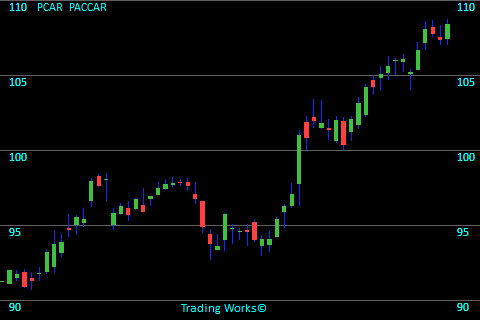
PCARPACCAR
PCAR is in the Farm & Heavy Construction Machinery sector. At the end of the trading day 14 days ago PCAR became attention worthy because it showed itself rising nicely. The stock closed back then at $102.02. The last closing price on this chart is $108.36 meaning the stock went up $6.34 per share. This works out to a 6.2% increase. To see more information click here: Todays chart for PCAR.
The chart on the right shows what we saw 14 trading days ago. The green arrows on the chart mark the point that we took interest. |
 |
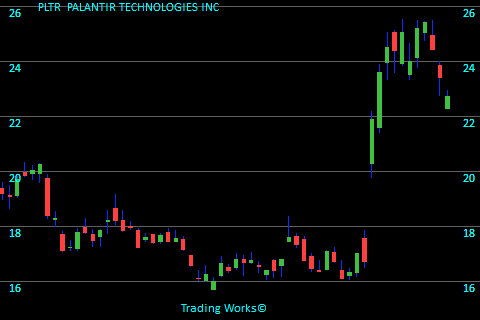
PLTRPALANTIR TECHNOLOGIES INC
PLTR is in the Software - Infrastructure sector. Not so long ago PLTR popped up on our screen because it has gained strength. The stock closed back then at $21.87. The last closing price on this chart is $22.74 meaning the stock advanced by $0.87 per share. This banks in at a 4.0% increase. To see more information click here: Todays chart for PLTR.
The chart on the right shows what we saw 11 trading days ago. The green arrows on the chart mark the point that we took interest. |
 |
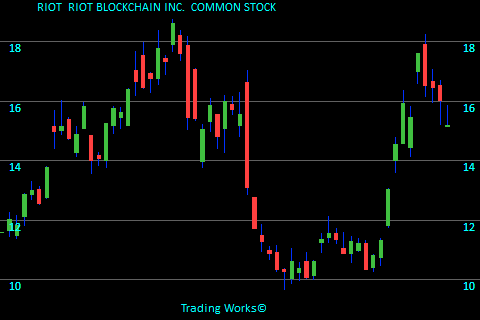
RIOTRIOT BLOCKCHAIN INC. COMMON STOCK
RIOT is categorized in the Capital Markets sector. At the end of the trading day 8 days ago RIOT popped up on our screen since it jumped in value recently. The stock closed back then at $14.55. The last closing price on this chart is $15.18 meaning the stock gained $0.63 per share. That looks like a 4.3% increase. To see more information click here: Todays chart for RIOT.
The chart on the right shows what we saw 8 trading days ago. The green arrows on the chart mark the point that we took interest. |
 |
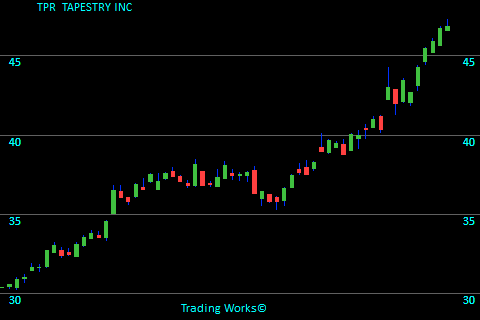
TPRTAPESTRY INC
TPR is categorized in the Luxury Goods sector. Not so long ago TPR grabbed 10 seconds of our time because this stock gained strength. The stock closed on that day at $40.02. The last closing price on this chart is $46.85 meaning the stock went up $6.83 per share. That calculates in at a 17.1% increase. To see more information click here: Todays chart for TPR.
The chart on the right shows what we saw 14 trading days ago. The green arrows on the chart mark the point that we took interest. |
 |
Trading stats for this day:
Total Value of stocks tracked is $87.4 Trillion.
Total Value recently traded was $442 Billion.
Total Value of Options traded (in our zone) was $2.1 Billion.
5,150,370 Call volume.
2,422,636 Put volume.
Blog Index
 © publishing since 2005.