 |
Blog on Stocks for February 15, 2024.
These stocks appeared on one of our screening reports approximately 10 trading days ago and are further
limited to ones that have some Stock-Options (Calls and Puts) with decent trading volume.
We provide these for education purposes only and not making a recommendation... especially on a delayed report.
We are just helping you see what you can do in a few short minutes per day.

Blog Index
|
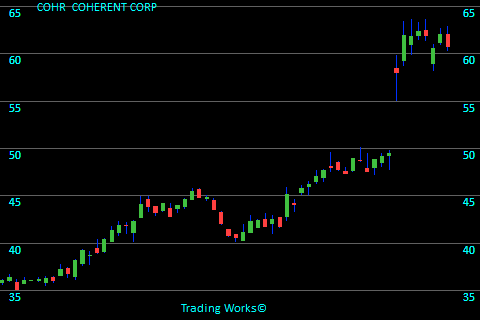
COHRCOHERENT CORP
COHR is part of the Scientific & Technical Instruments sector. At the end of the trading day 11 days ago COHR was listed in our Strong Trend report because it looks like an emerging opportunity. The stock closed on that day at $48.79. The last closing price on this chart is $60.78 meaning the stock climbed by $11.99 per share. This banks in at a 24.6% increase. To see more information click here: Todays chart for COHR.
The chart on the right shows what we saw 11 trading days ago. The green arrows on the chart mark the point that we took interest. |
 |
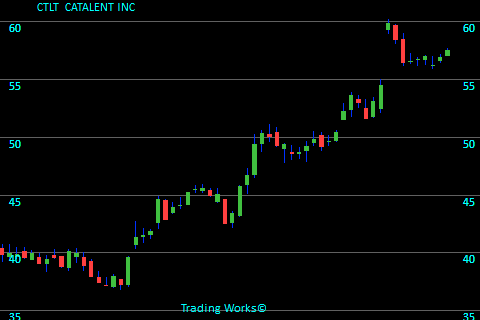
CTLTCATALENT INC
CTLT belongs to the Drug Manufacturers - Specialty & Generic sector. At the end of the trading day 11 days ago CTLT showed up on our stock radar because it has moved up sharply in recent days. The stock closed for that day at $53.09. At the time of this blog, the attached chart show a last price of $57.49 meaning the stock gained $4.40 per share. That equates to a 8.3% increase. To see more information click here: Todays chart for CTLT.
The chart on the right shows what we saw 11 trading days ago. The green arrows on the chart mark the point that we took interest. |
 |
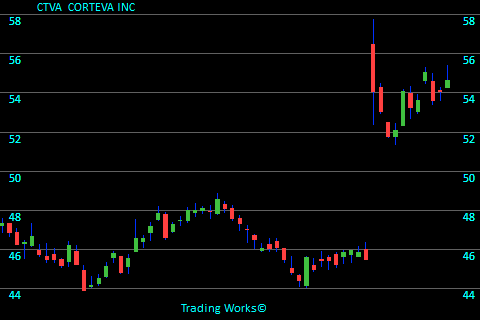
CTVACORTEVA INC
CTVA fits in the Agricultural Inputs sector. At the end of the trading day 11 days ago CTVA grabbed 10 seconds of our time because this stock gained strength. The stock closed back then at $54.06. Referring to the chart here, the last price is $54.65 meaning the stock gained $0.59 per share. That equates to a 1.1% increase. To see more information click here: Todays chart for CTVA.
The chart on the right shows what we saw 11 trading days ago. The green arrows on the chart mark the point that we took interest. |
 |
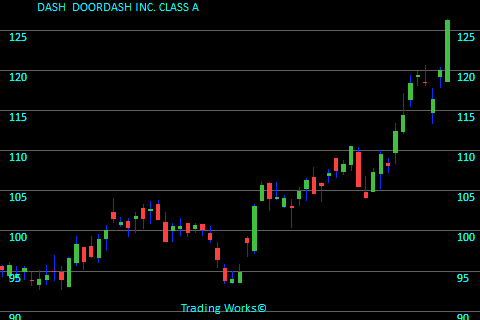
DASHDOORDASH INC. CLASS A
DASH fits in the Internet Content & Information sector. Only a few days ago DASH caused us to review the chart because it looks like an emerging opportunity. The stock closed on that day at $112.34. Referring to the chart here, the last price is $126.24 meaning the stock had risen by $13.90 per share. That looks like a 12.4% increase. To see more information click here: Todays chart for DASH.
The chart on the right shows what we saw 8 trading days ago. The green arrows on the chart mark the point that we took interest. |
 |
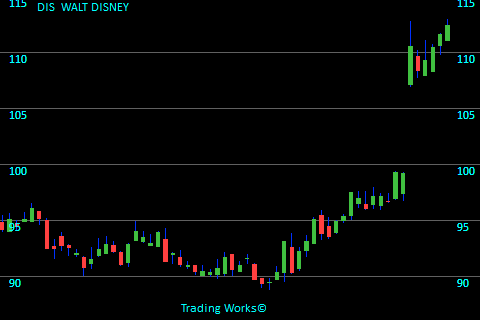
DISWALT DISNEY
DIS is grouped in the Entertainment sector. Recently DIS caught our attention because the price increase was exceeding the expected pace. The stock closed back then at $99.29. The last closing price on this chart is $112.34 meaning the stock moved up $13.05 per share. It computes to a 13.1% increase. To see more information click here: Todays chart for DIS.
The chart on the right shows what we saw 8 trading days ago. The green arrows on the chart mark the point that we took interest. |
 |
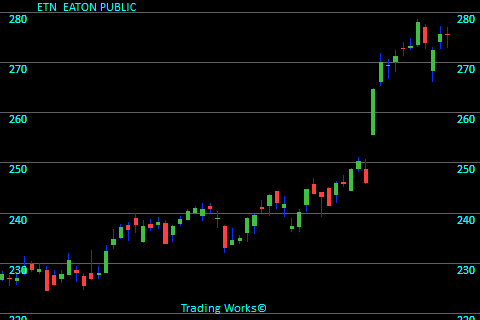
ETNEATON PUBLIC
ETN belongs to the Specialty Industrial Machinery sector. At the end of the trading day 11 days ago ETN grabbed 10 seconds of our time because it showed itself rising nicely. The stock ended trading at $264.57. The last closing price on this chart is $275.60 meaning the stock rose $11.03 per share. It computes to a 4.2% increase. To see more information click here: Todays chart for ETN.
The chart on the right shows what we saw 11 trading days ago. The green arrows on the chart mark the point that we took interest. |
 |
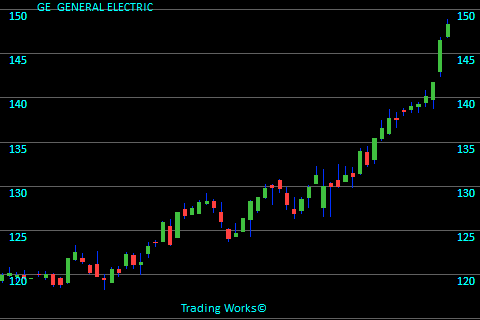
GEGENERAL ELECTRIC
GE fits in the Specialty Industrial Machinery sector. It was 11 days ago that GE gave us a reason to review the charts because the price increase was exceeding the expected pace. The stock closed on that day at $135.41. The last closing price on this chart is $148.36 meaning the stock moved up $12.95 per share. That looks like a 9.6% increase. To see more information click here: Todays chart for GE.
The chart on the right shows what we saw 11 trading days ago. The green arrows on the chart mark the point that we took interest. |
 |
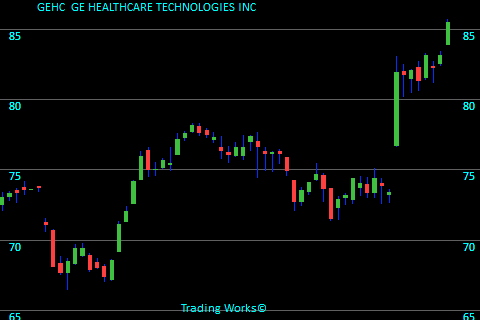
GEHCGE HEALTHCARE TECHNOLOGIES INC
GEHC belongs to the Health Information Services sector. Only a few days ago GEHC was listed in our Strong Trend report because it has gained strength. The stock closed for that day at $81.96. For this chart, the closing price is $85.52 meaning the stock went up $3.56 per share. This banks in at a 4.3% increase. To see more information click here: Todays chart for GEHC.
The chart on the right shows what we saw 8 trading days ago. The green arrows on the chart mark the point that we took interest. |
 |
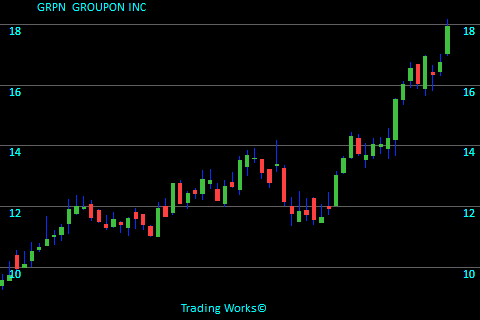
GRPNGROUPON INC
GRPN is in the Internet Content & Information sector. Recently GRPN was listed in our Strong Trend report because this stock gained strength. The stock finished trading at $15.52. Looking at this chart we see the final price is $17.93 meaning the stock rose $2.41 per share. This works out to a 15.5% increase. To see more information click here: Todays chart for GRPN.
The chart on the right shows what we saw 8 trading days ago. The green arrows on the chart mark the point that we took interest. |
 |
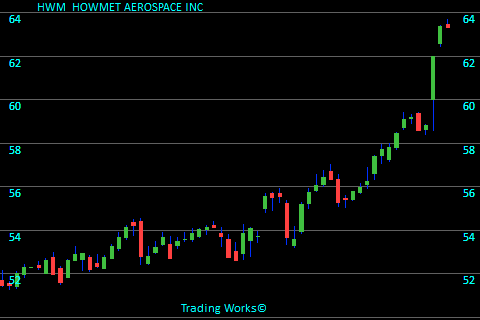
HWMHOWMET AEROSPACE INC
HWM is categorized in the Aerospace & Defense sector. At the end of the trading day 11 days ago HWM was listed in our Strong Trend report because it has gained strength. The stock finished trading at $57.38. Looking at this chart we see the final price is $63.31 meaning the stock moved up $5.93 per share. This banks in at a 10.3% increase. To see more information click here: Todays chart for HWM.
The chart on the right shows what we saw 11 trading days ago. The green arrows on the chart mark the point that we took interest. |
 |
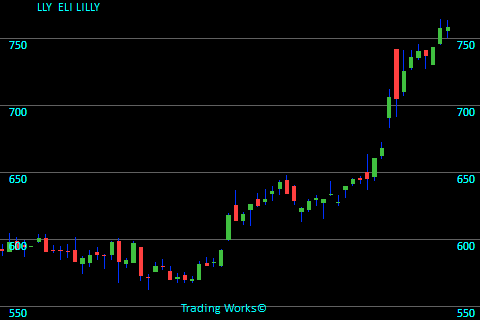
LLYELI LILLY
LLY is in the Drug Manufacturers - General sector. Only a few days ago LLY caught our attention due to the fact it had a good improvement in its price. The stock ended trading at $660.43. For this chart, the closing price is $758.32 meaning the stock had risen by $97.89 per share. That looks like a 14.8% increase. To see more information click here: Todays chart for LLY.
The chart on the right shows what we saw 11 trading days ago. The green arrows on the chart mark the point that we took interest. |
 |
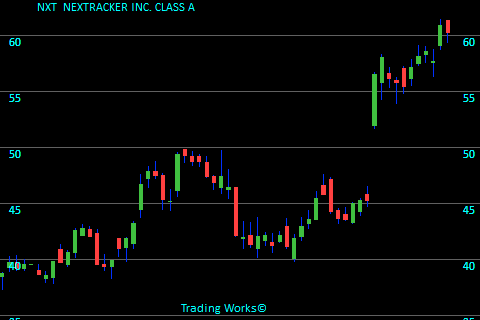
NXTNEXTRACKER INC. CLASS A
NXT is associated with the Solar sector. It was 11 days ago that NXT caught our attention due to the fact it had a good improvement in its price. The stock closed on that day at $56.50. The last closing price on this chart is $60.21 meaning the stock rose $3.71 per share. That calculates in at a 6.6% increase. To see more information click here: Todays chart for NXT.
The chart on the right shows what we saw 11 trading days ago. The green arrows on the chart mark the point that we took interest. |
 |
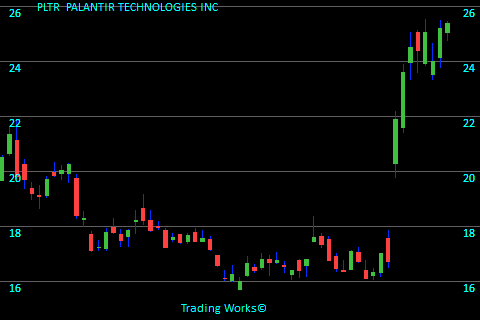
PLTRPALANTIR TECHNOLOGIES INC
PLTR is linked with the Software - Infrastructure sector. It was 8 days ago that PLTR grabbed 10 seconds of our time due to the fact it had a good improvement in its price. The stock closed for that day at $21.87. The last closing price on this chart is $25.39 meaning the stock increased by $3.52 per share. It computes to a 16.1% increase. To see more information click here: Todays chart for PLTR.
The chart on the right shows what we saw 8 trading days ago. The green arrows on the chart mark the point that we took interest. |
 |
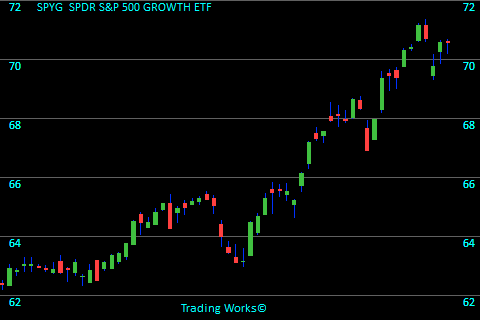
SPYGSPDR S&P 500 GROWTH ETF
Recently (11 days ago) SPYG was listed in our Strong Trend report on this day because the closing price finished higher than previous averages. The stock closed on that day at $67.98. The last closing price on this chart is $70.59 meaning the stock advanced by $2.61 per share. It computes to a 3.8% increase. To see more information click here: Todays chart for SPYG.
The chart on the right shows what we saw 11 trading days ago. The green arrows on the chart mark the point that we took interest. |
 |
Trading stats for this day:
Total Value of stocks tracked is $88.6 Trillion.
Total Value recently traded was $503 Billion.
Total Value of Options traded (in our zone) was $2.4 Billion.
6,652,597 Call volume.
3,947,749 Put volume.
Blog Index
 © publishing since 2005.