 |
Blog on Stocks for February 14, 2024.
These stocks appeared on one of our screening reports approximately 10 trading days ago and are further
limited to ones that have some Stock-Options (Calls and Puts) with decent trading volume.
We provide these for education purposes only and not making a recommendation... especially on a delayed report.
We are just helping you see what you can do in a few short minutes per day.

Blog Index
|
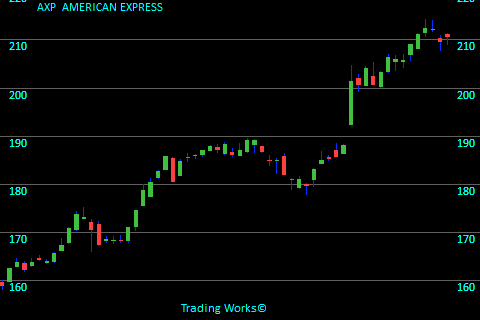
AXPAMERICAN EXPRESS
AXP stands in the Credit Services sector. Recently AXP grabbed 10 seconds of our time because it has moved up sharply in recent days. The stock finished trading at $201.43. Looking at this chart we see the final price is $210.80 meaning the stock went up $9.37 per share. That equates to a 4.7% increase. To see more information click here: Todays chart for AXP.
The chart on the right shows what we saw 14 trading days ago. The green arrows on the chart mark the point that we took interest. |
 |
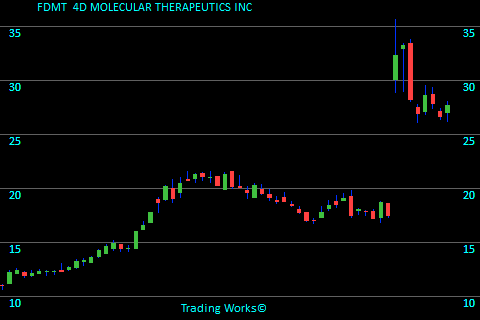
FDMT4D MOLECULAR THERAPEUTICS INC
FDMT is in the Biotechnology sector. It was 8 days ago that FDMT grabbed 10 seconds of our time There is no guarantee that it will rise, but it's certainly worth watching. To see more information click here: Todays chart for FDMT.
The chart on the right shows what we saw 8 trading days ago. The green arrows on the chart mark the point that we took interest. |
 |
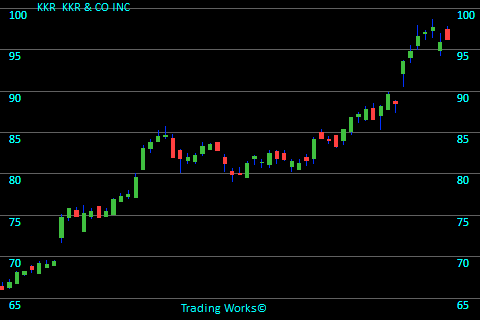
KKRKKR & CO INC
KKR is related to the Asset Management sector. Not long ago KKR popped up on our screen since it jumped in value recently. The stock closed on that day at $86.75. At the time of this blog, the attached chart show a last price of $96.21 meaning the stock went up $9.46 per share. That looks like a 10.9% increase. To see more information click here: Todays chart for KKR.
The chart on the right shows what we saw 14 trading days ago. The green arrows on the chart mark the point that we took interest. |
 |
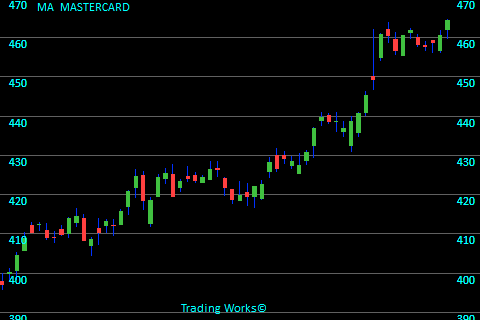
MAMASTERCARD
MA belongs to the Credit Services sector. Not long ago MA gave us a reason to review the charts because this stock gained strength. The stock finished trading at $438.53. The last closing price on this chart is $464.47 meaning the stock had risen by $25.94 per share. That equates to a 5.9% increase. To see more information click here: Todays chart for MA.
The chart on the right shows what we saw 14 trading days ago. The green arrows on the chart mark the point that we took interest. |
 |
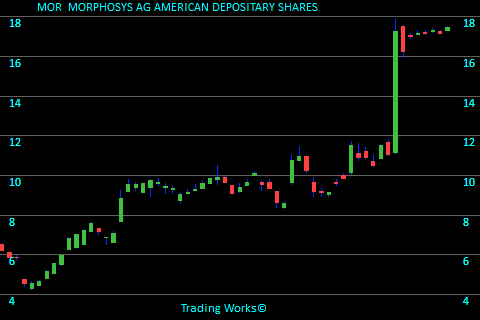
MORMORPHOSYS AG AMERICAN DEPOSITARY SHARES
MOR is in the Biotechnology sector. Just 8 days ago MOR became attention worthy because it was showing upward strength in the price. The stock closed for that day at $17.27. The last closing price on this chart is $17.47 meaning the stock rose $0.20 per share. That looks like a 1.2% increase. To see more information click here: Todays chart for MOR.
The chart on the right shows what we saw 8 trading days ago. The green arrows on the chart mark the point that we took interest. |
 |
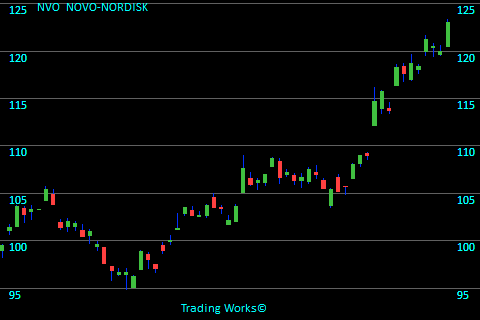
NVONOVO-NORDISK
NVO belongs to the Biotechnology sector. Only 11 days ago NVO caused us to review the chart since it jumped in value recently. The stock closed back then at $114.74. At the time of this blog, the attached chart show a last price of $123.02 meaning the stock advanced by $8.28 per share. That looks like a 7.2% increase. To see more information click here: Todays chart for NVO.
The chart on the right shows what we saw 11 trading days ago. The green arrows on the chart mark the point that we took interest. |
 |
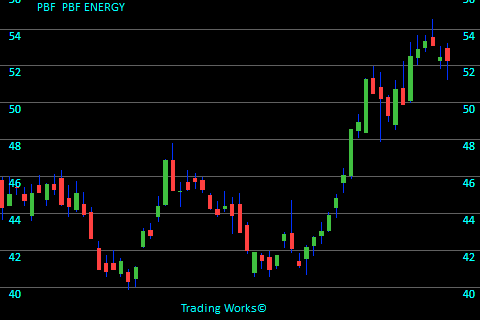
PBFPBF ENERGY
PBF is in the Oil & Gas Refining & Marketing sector. Recently (14 days ago) PBF gave us a reason to review the charts because the price increase was exceeding the expected pace. The stock ended trading at $48.54. The last closing price on this chart is $52.32 meaning the stock moved up $3.78 per share. That calculates in at a 7.8% increase. To see more information click here: Todays chart for PBF.
The chart on the right shows what we saw 14 trading days ago. The green arrows on the chart mark the point that we took interest. |
 |
Trading stats for this day:
Total Value of stocks tracked is $87.9 Trillion.
Total Value recently traded was $481 Billion.
Total Value of Options traded (in our zone) was $3.0 Billion.
6,479,387 Call volume.
3,084,948 Put volume.
Blog Index
 © publishing since 2005.