 |
Blog on Stocks for February 13, 2024.
These stocks appeared on one of our screening reports approximately 10 trading days ago and are further
limited to ones that have some Stock-Options (Calls and Puts) with decent trading volume.
We provide these for education purposes only and not making a recommendation... especially on a delayed report.
We are just helping you see what you can do in a few short minutes per day.

Blog Index
|
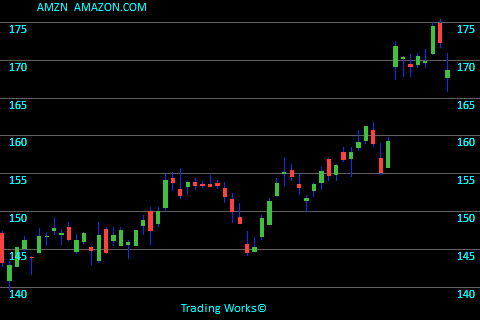
AMZNAMAZON.COM
AMZN is related to the Internet Retail sector. Recently (8 days ago) AMZN became attention worthy There is no guarantee that it will rise, but it's certainly worth watching. To see more information click here: Todays chart for AMZN.
The chart on the right shows what we saw 8 trading days ago. The green arrows on the chart mark the point that we took interest. |
 |
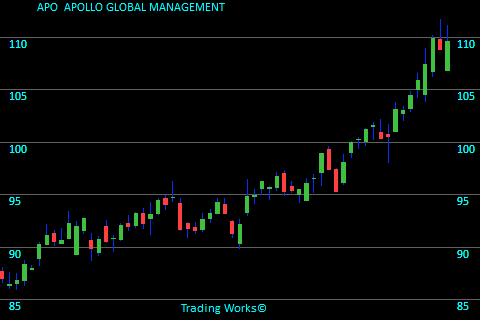
APOAPOLLO GLOBAL MANAGEMENT
APO is linked with the Asset Management sector. Recently APO became attention worthy on this day because the closing price finished higher than previous averages. The stock closed on that day at $103.13. For this chart, the closing price is $109.63 meaning the stock rose $6.50 per share. This works out to a 6.3% increase. To see more information click here: Todays chart for APO.
The chart on the right shows what we saw 8 trading days ago. The green arrows on the chart mark the point that we took interest. |
 |
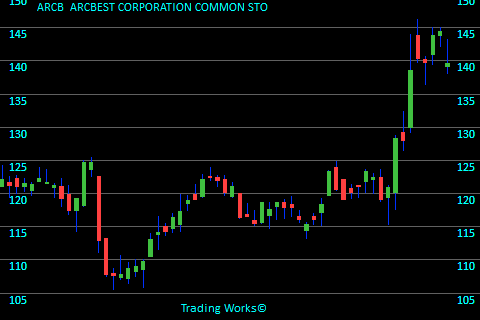
ARCBARCBEST CORPORATION COMMON STO
ARCB is linked with the Trucking sector. Recently ARCB grabbed 10 seconds of our time on this day because the closing price finished higher than previous averages. The stock closed on that day at $128.35. For this chart, the closing price is $139.60 meaning the stock rose $11.25 per share. This banks in at a 8.8% increase. To see more information click here: Todays chart for ARCB.
The chart on the right shows what we saw 8 trading days ago. The green arrows on the chart mark the point that we took interest. |
 |
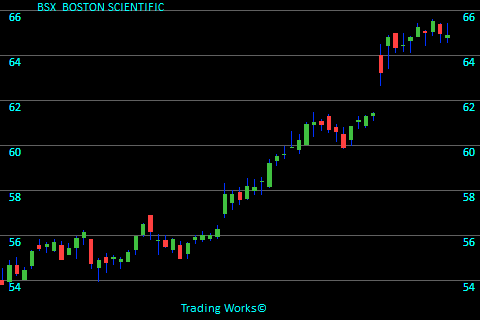
BSXBOSTON SCIENTIFIC
BSX is part of the Medical Devices sector. It was 14 days ago that BSX grabbed 10 seconds of our time because it has gained strength. The stock closed back then at $60.83. Referring to the chart here, the last price is $64.89 meaning the stock increased by $4.06 per share. This banks in at a 6.7% increase. To see more information click here: Todays chart for BSX.
The chart on the right shows what we saw 14 trading days ago. The green arrows on the chart mark the point that we took interest. |
 |
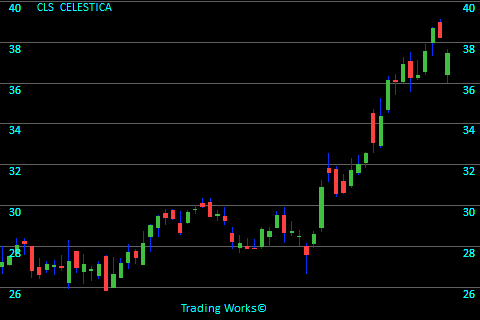
CLSCELESTICA
CLS stands in the Electronic Components sector. Just 14 days ago CLS became attention worthy because it was showing upward strength in the price. The stock finished trading at $31.72. The last closing price on this chart is $37.45 meaning the stock had risen by $5.73 per share. This works out to a 18.1% increase. To see more information click here: Todays chart for CLS.
The chart on the right shows what we saw 14 trading days ago. The green arrows on the chart mark the point that we took interest. |
 |
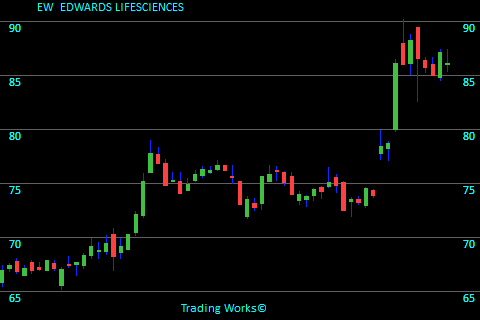
EWEDWARDS LIFESCIENCES
EW is categorized in the Medical Devices sector. Not long ago EW grabbed 10 seconds of our time due to the fact it had a good improvement in its price. The stock closed for that day at $86.09. Looking at this chart we see the final price is $86.16 meaning the stock went up $0.07 per share. That looks like a 0.1% increase. To see more information click here: Todays chart for EW.
The chart on the right shows what we saw 8 trading days ago. The green arrows on the chart mark the point that we took interest. |
 |
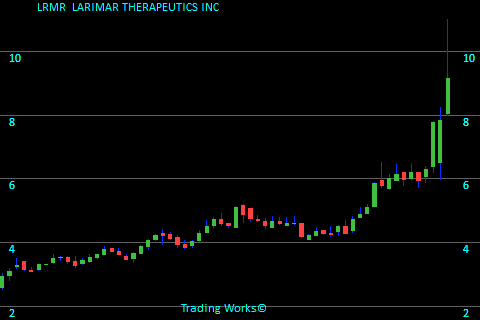
LRMRLARIMAR THERAPEUTICS INC
LRMR belongs to the Biotechnology sector. Not long ago LRMR was listed in our Strong Trend report because it has moved up sharply in recent days. The stock closed on that day at $5.85. The last closing price on this chart is $9.16 meaning the stock rose $3.31 per share. That equates to a 56.6% increase. To see more information click here: Todays chart for LRMR.
The chart on the right shows what we saw 11 trading days ago. The green arrows on the chart mark the point that we took interest. |
 |
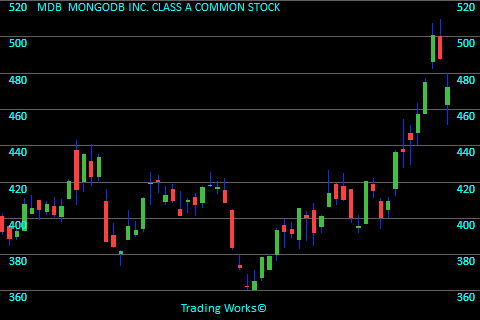
MDBMONGODB INC. CLASS A COMMON STOCK
MDB is categorized under the Software - Infrastructure sector. It was 8 days ago that MDB gave us a reason to review the charts because it was showing upward strength in the price. The stock finished trading at $436.01. Looking at this chart we see the final price is $472.34 meaning the stock climbed by $36.33 per share. That looks like a 8.3% increase. To see more information click here: Todays chart for MDB.
The chart on the right shows what we saw 8 trading days ago. The green arrows on the chart mark the point that we took interest. |
 |
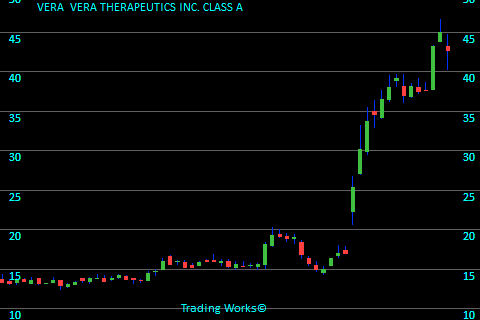
VERAVERA THERAPEUTICS INC. CLASS A
VERA is in the Biotechnology sector. A few days back VERA showed up on our stock radar because it looks like an emerging opportunity. The stock finished trading at $25.31. Referring to the chart here, the last price is $42.69 meaning the stock moved up $17.38 per share. That looks like a 68.7% increase. To see more information click here: Todays chart for VERA.
The chart on the right shows what we saw 14 trading days ago. The green arrows on the chart mark the point that we took interest. |
 |
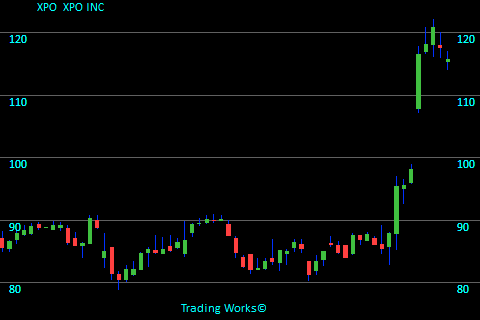
XPOXPO INC
XPO is grouped in the Trucking sector. A few days back XPO caused us to review the chart because it has moved up sharply in recent days. The stock closed on that day at $95.34. Referring to the chart here, the last price is $115.64 meaning the stock gained $20.30 per share. This works out to a 21.3% increase. To see more information click here: Todays chart for XPO.
The chart on the right shows what we saw 8 trading days ago. The green arrows on the chart mark the point that we took interest. |
 |
Trading stats for this day:
Total Value of stocks tracked is $87.0 Trillion.
Total Value recently traded was $579 Billion.
Total Value of Options traded (in our zone) was $2.5 Billion.
5,749,380 Call volume.
2,213,869 Put volume.
Blog Index
 © publishing since 2005.