 |
Blog on Stocks for February 12, 2024.
These stocks appeared on one of our screening reports approximately 10 trading days ago and are further
limited to ones that have some Stock-Options (Calls and Puts) with decent trading volume.
We provide these for education purposes only and not making a recommendation... especially on a delayed report.
We are just helping you see what you can do in a few short minutes per day.

Blog Index
|
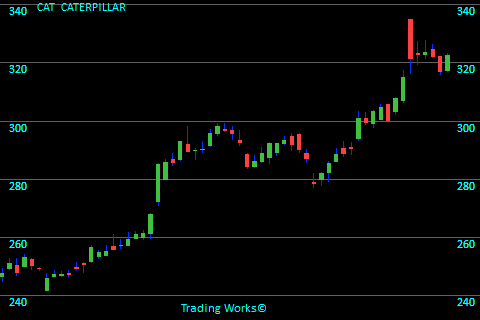
CATCATERPILLAR
CAT is linked with the Farm & Heavy Construction Machinery sector. A few days back CAT grabbed 10 seconds of our time because it was showing upward strength in the price. The stock finished trading at $307.69. Referring to the chart here, the last price is $322.39 meaning the stock moved up $14.70 per share. This banks in at a 4.8% increase. To see more information click here: Todays chart for CAT.
The chart on the right shows what we saw 8 trading days ago. The green arrows on the chart mark the point that we took interest. |
 |
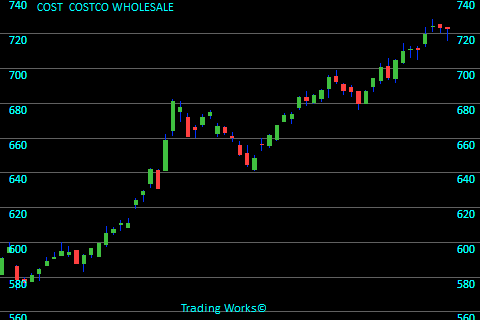
COSTCOSTCO WHOLESALE
COST is categorized under the Discount Stores sector. Just 11 days ago COST gave us a reason to review the charts because the price increase was exceeding the expected pace. The stock ended trading at $694.01. Looking at this chart we see the final price is $722.85 meaning the stock had risen by $28.84 per share. It computes to a 4.2% increase. To see more information click here: Todays chart for COST.
The chart on the right shows what we saw 11 trading days ago. The green arrows on the chart mark the point that we took interest. |
 |
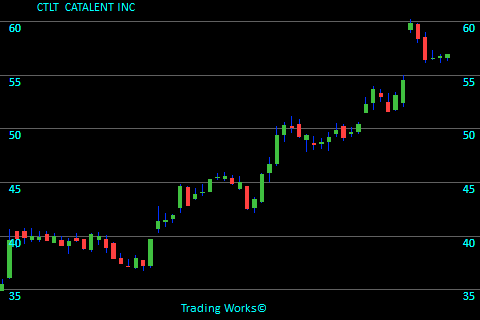
CTLTCATALENT INC
CTLT is grouped in the Drug Manufacturers - Specialty & Generic sector. Not long ago CTLT deserved some scrutiny because this stock gained strength. The stock ended trading at $53.09. Looking at this chart we see the final price is $56.89 meaning the stock increased by $3.80 per share. This works out to a 7.2% increase. To see more information click here: Todays chart for CTLT.
The chart on the right shows what we saw 8 trading days ago. The green arrows on the chart mark the point that we took interest. |
 |
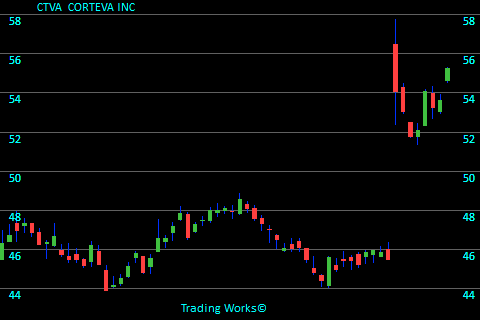
CTVACORTEVA INC
CTVA stands in the Agricultural Inputs sector. Recently (8 days ago) CTVA deserved some scrutiny because the price increase was exceeding the expected pace. The stock finished trading at $54.06. The last closing price on this chart is $55.25 meaning the stock went up $1.19 per share. It computes to a 2.2% increase. To see more information click here: Todays chart for CTVA.
The chart on the right shows what we saw 8 trading days ago. The green arrows on the chart mark the point that we took interest. |
 |
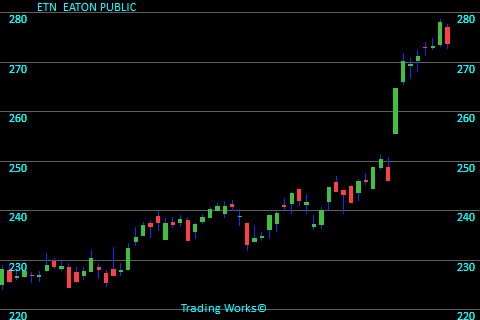
ETNEATON PUBLIC
ETN is related to the Specialty Industrial Machinery sector. It was 8 days ago that ETN caught our attention because it showed itself rising nicely. The stock finished trading at $264.57. The last closing price on this chart is $273.64 meaning the stock gained $9.07 per share. That equates to a 3.4% increase. To see more information click here: Todays chart for ETN.
The chart on the right shows what we saw 8 trading days ago. The green arrows on the chart mark the point that we took interest. |
 |
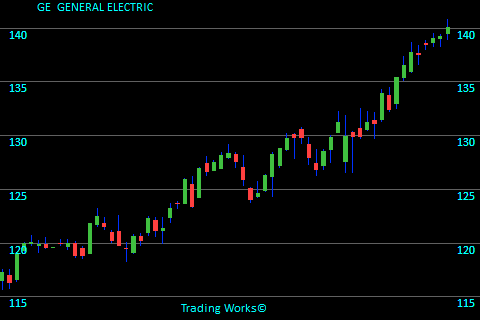
GEGENERAL ELECTRIC
GE is in the Specialty Industrial Machinery sector. At the end of the trading day 8 days ago GE deserved some scrutiny because it looks like an emerging opportunity. The stock finished trading at $135.41. Looking at this chart we see the final price is $140.11 meaning the stock went up $4.70 per share. This works out to a 3.5% increase. To see more information click here: Todays chart for GE.
The chart on the right shows what we saw 8 trading days ago. The green arrows on the chart mark the point that we took interest. |
 |
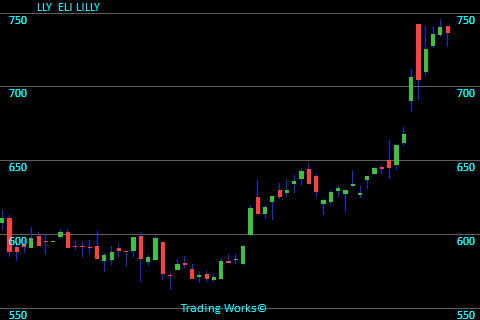
LLYELI LILLY
LLY is categorized under the Drug Manufacturers - General sector. Recently (8 days ago) LLY became attention worthy because the stock is holding above the previous trading range. The stock finished trading at $660.43. Referring to the chart here, the last price is $737.16 meaning the stock rose $76.73 per share. That equates to a 11.6% increase. To see more information click here: Todays chart for LLY.
The chart on the right shows what we saw 8 trading days ago. The green arrows on the chart mark the point that we took interest. |
 |
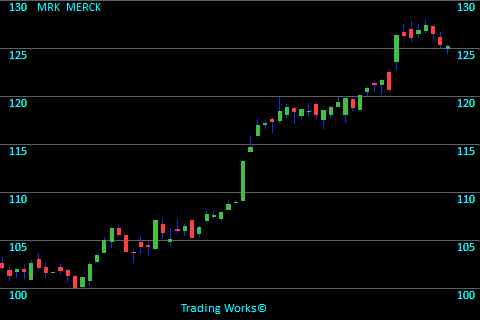
MRKMERCK
MRK fits in the Drug Manufacturers - General sector. Just 8 days ago MRK showed up on our stock radar There is no guarantee that it will rise, but it's certainly worth watching. To see more information click here: Todays chart for MRK.
The chart on the right shows what we saw 8 trading days ago. The green arrows on the chart mark the point that we took interest. |
 |
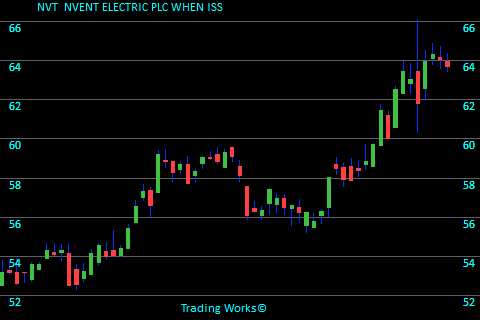
NVTNVENT ELECTRIC PLC WHEN ISS
NVT stands in the Electrical Equipment & Parts sector. Not so long ago NVT showed up on our stock radar due to the fact it had a good improvement in its price. The stock closed back then at $62.50. Referring to the chart here, the last price is $63.69 meaning the stock had risen by $1.19 per share. This banks in at a 1.9% increase. To see more information click here: Todays chart for NVT.
The chart on the right shows what we saw 8 trading days ago. The green arrows on the chart mark the point that we took interest. |
 |
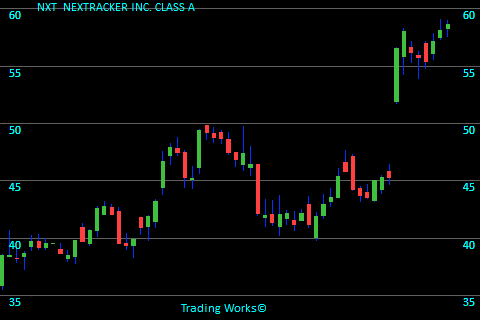
NXTNEXTRACKER INC. CLASS A
NXT stands in the Solar sector. Only 8 days ago NXT became attention worthy because the stock is holding above the previous trading range. The stock ended trading at $56.50. Referring to the chart here, the last price is $58.64 meaning the stock had risen by $2.14 per share. That equates to a 3.8% increase. To see more information click here: Todays chart for NXT.
The chart on the right shows what we saw 8 trading days ago. The green arrows on the chart mark the point that we took interest. |
 |
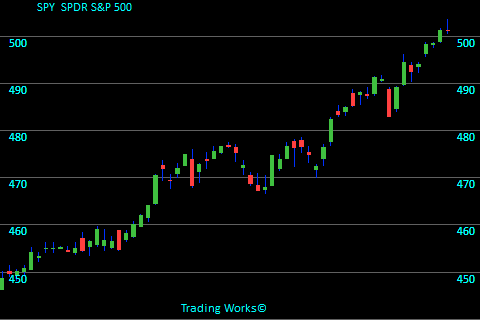
SPYSPDR S&P 500
A few days back SPY was listed in our Strong Trend report because the price increase was exceeding the expected pace. The stock ended trading at $489.20. Referring to the chart here, the last price is $501.16 meaning the stock increased by $11.96 per share. That equates to a 2.4% increase. To see more information click here: Todays chart for SPY.
The chart on the right shows what we saw 8 trading days ago. The green arrows on the chart mark the point that we took interest. |
 |
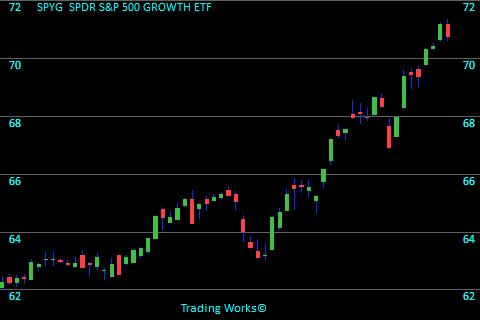
SPYGSPDR S&P 500 GROWTH ETF
A few days back SPYG was listed in our Strong Trend report because the price increase was exceeding the expected pace. The stock finished trading at $67.98. Looking at this chart we see the final price is $70.77 meaning the stock rose $2.79 per share. It computes to a 4.1% increase. To see more information click here: Todays chart for SPYG.
The chart on the right shows what we saw 8 trading days ago. The green arrows on the chart mark the point that we took interest. |
 |
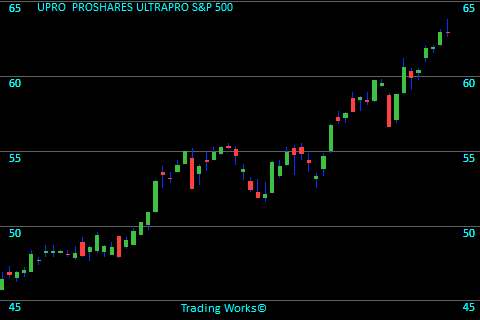
UPROPROSHARES ULTRAPRO S&P 500
Not so long ago UPRO showed up on our stock radar since it jumped in value recently. The stock ended trading at $58.77. The last closing price on this chart is $62.93 meaning the stock gained $4.16 per share. This works out to a 7.1% increase. To see more information click here: Todays chart for UPRO.
The chart on the right shows what we saw 8 trading days ago. The green arrows on the chart mark the point that we took interest. |
 |
Trading stats for this day:
Total Value of stocks tracked is $88.6 Trillion.
Total Value recently traded was $461 Billion.
Total Value of Options traded (in our zone) was $2.7 Billion.
6,333,644 Call volume.
2,872,298 Put volume.
Blog Index
 © publishing since 2005.