 |
Blog on Stocks for February 9, 2024.
These stocks appeared on one of our screening reports approximately 10 trading days ago and are further
limited to ones that have some Stock-Options (Calls and Puts) with decent trading volume.
We provide these for education purposes only and not making a recommendation... especially on a delayed report.
We are just helping you see what you can do in a few short minutes per day.

Blog Index
|
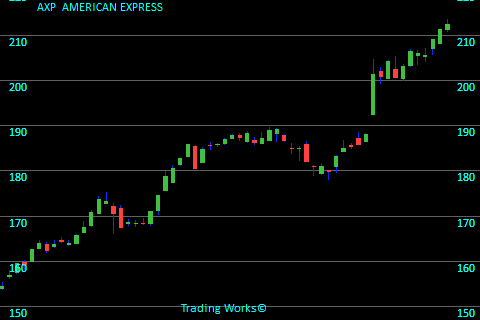
AXPAMERICAN EXPRESS
AXP is related to the Credit Services sector. It was 11 days ago that AXP popped up on our screen because it has gained strength. The stock closed back then at $201.43. Referring to the chart here, the last price is $212.44 meaning the stock increased by $11.01 per share. This works out to a 5.5% increase. To see more information click here: Todays chart for AXP.
The chart on the right shows what we saw 11 trading days ago. The green arrows on the chart mark the point that we took interest. |
 |
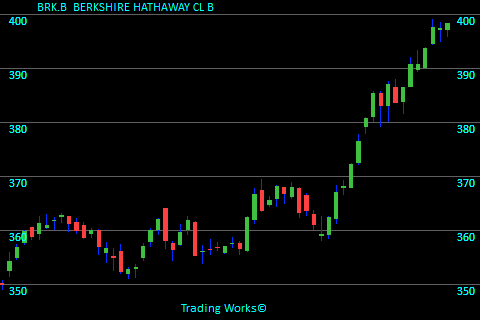
BRK.BBERKSHIRE HATHAWAY CL B
BRK.B is grouped in the Insurance - Diversified sector. Recently BRK.B became attention worthy because the stock is holding above the previous trading range. The stock finished trading at $372.14. Referring to the chart here, the last price is $398.36 meaning the stock climbed by $26.22 per share. This works out to a 7.0% increase. To see more information click here: Todays chart for BRK.B.
The chart on the right shows what we saw 14 trading days ago. The green arrows on the chart mark the point that we took interest. |
 |
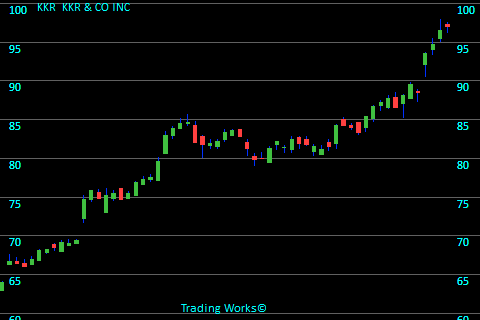
KKRKKR & CO INC
KKR is linked with the Asset Management sector. Not long ago KKR was listed in our Strong Trend report because it has moved up sharply in recent days. The stock finished trading at $86.75. The last closing price on this chart is $97.01 meaning the stock moved up $10.26 per share. That equates to a 11.8% increase. To see more information click here: Todays chart for KKR.
The chart on the right shows what we saw 11 trading days ago. The green arrows on the chart mark the point that we took interest. |
 |
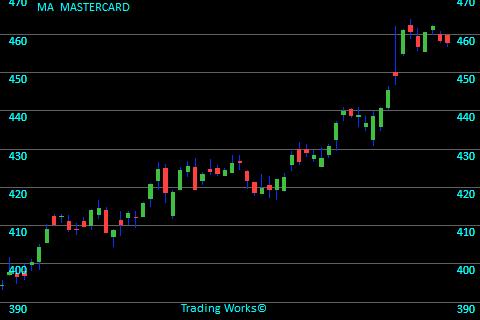
MAMASTERCARD
MA fits in the Credit Services sector. Not long ago MA caught our attention since it jumped in value recently. The stock closed back then at $438.53. Looking at this chart we see the final price is $457.75 meaning the stock climbed by $19.22 per share. That equates to a 4.4% increase. To see more information click here: Todays chart for MA.
The chart on the right shows what we saw 11 trading days ago. The green arrows on the chart mark the point that we took interest. |
 |
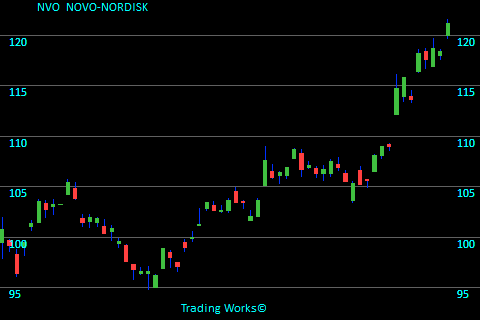
NVONOVO-NORDISK
NVO is related to the Biotechnology sector. Recently (8 days ago) NVO showed up on our stock radar because the price increase was exceeding the expected pace. The stock closed on that day at $114.74. The last closing price on this chart is $121.17 meaning the stock had risen by $6.43 per share. That equates to a 5.6% increase. To see more information click here: Todays chart for NVO.
The chart on the right shows what we saw 8 trading days ago. The green arrows on the chart mark the point that we took interest. |
 |
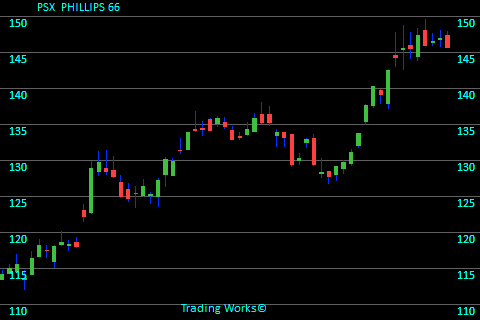
PSXPHILLIPS 66
PSX is linked with the Oil & Gas Refining & Marketing sector. It was 11 days ago that PSX popped up on our screen because it has moved up sharply in recent days. The stock closed for that day at $140.22. Looking at this chart we see the final price is $145.66 meaning the stock rose $5.44 per share. This works out to a 3.9% increase. To see more information click here: Todays chart for PSX.
The chart on the right shows what we saw 11 trading days ago. The green arrows on the chart mark the point that we took interest. |
 |
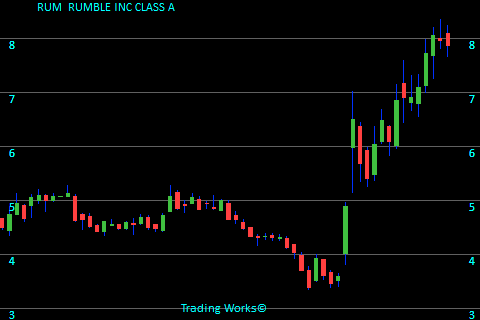
RUMRUMBLE INC CLASS A
RUM is linked with the Software - Application sector. Not long ago RUM deserved some scrutiny because it was showing upward strength in the price. The stock finished trading at $6.50. For this chart, the closing price is $7.88 meaning the stock increased by $1.38 per share. It computes to a 21.2% increase. To see more information click here: Todays chart for RUM.
The chart on the right shows what we saw 14 trading days ago. The green arrows on the chart mark the point that we took interest. |
 |
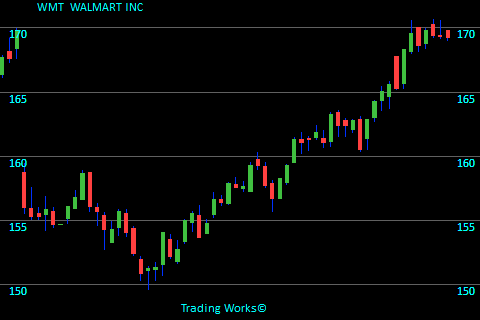
WMTWALMART INC
WMT is categorized in the Discount Stores sector. Only a few days ago WMT popped up on our screen because this stock gained strength. The stock ended trading at $164.27. For this chart, the closing price is $169.27 meaning the stock went up $5.00 per share. That looks like a 3.0% increase. To see more information click here: Todays chart for WMT.
The chart on the right shows what we saw 11 trading days ago. The green arrows on the chart mark the point that we took interest. |
 |
Trading stats for this day:
Total Value of stocks tracked is $88.4 Trillion.
Total Value recently traded was $513 Billion.
Total Value of Options traded (in our zone) was $1.2 Billion.
2,917,970 Call volume.
1,309,777 Put volume.
Blog Index
 © publishing since 2005.